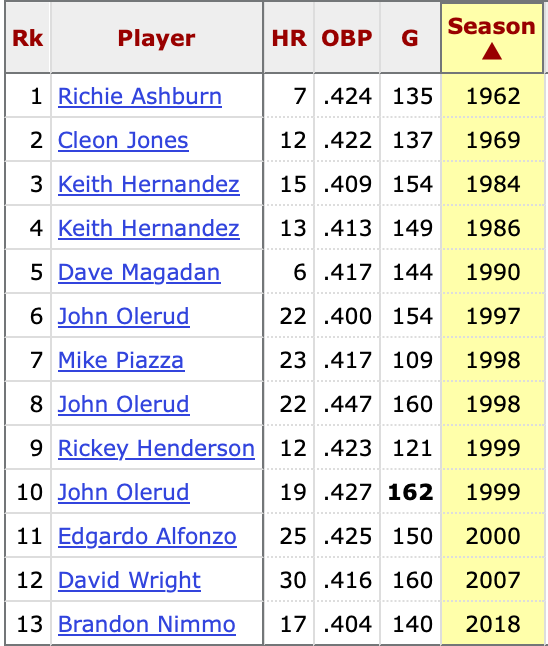
Since 1962, only 13 Mets who have played in at least 100 games in a season have had an OBP of .400 or above. The first was Richie Ashburn in 1962. His .424 OBP was not topped until 36 years later when John Olerud had a .447 OBP, a number no other Met has come close to through 2024.
Mets top OBPs in a season
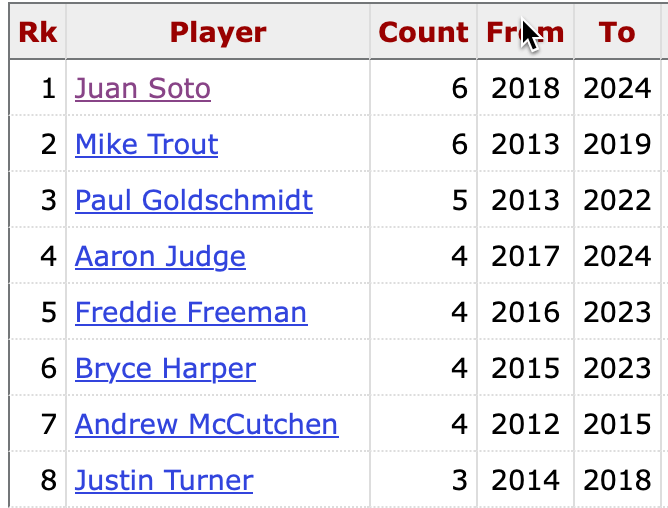
That might change this season. Juan Soto, one of only two active players with an OBP >= .400 over at least 100 games in six seasons — the other is Mike Trout — is now a Met. However, Soto exceeded Olerud’s .427 OBP just once when he reached .465 in 2021 with the Nationals. In his other five seasons, Soto’s highest OBP was .419, accomplished last season with the Yankees.
Active players with most seasons with OBP >= .400 & Games >= 100
Among the active Mets players besides Soto, only one had an OBP >= .400 in at least 100 games in a season, Brandon Nimmo doing it once, but that was seven years ago when his OBP was .404.
Justin Turner played for the Mets from 2010 through 2013. During those years, his highest OBP was .334. After the 2013 season, he became a free agent and signed with the Dodgers. In three of his season with them, he had an OBP over .400 three times, playing more than 100 games in each.
❓I’ve wondered why he couldn’t hit like that with the Mets.
When doing a statistical analysis involving baseball, I needed to find out for how many consecutive years a player has played for a team. In this article, I reveal one way of doing that using R. One of the R programming language’s amazing capabilities is how much you can accomplish with just a small amount of code1.
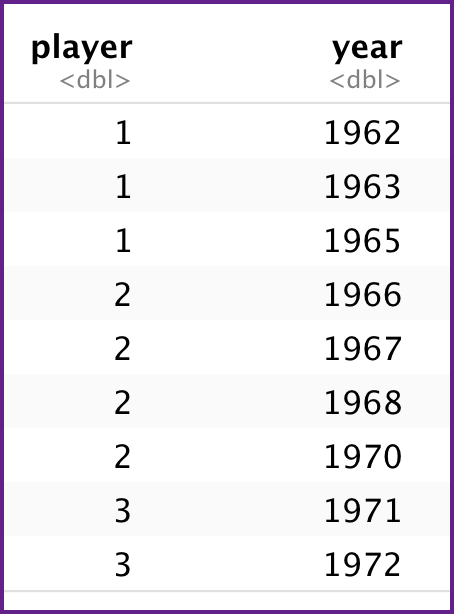
In the diagram below, data is shown for three players. The stint (number of years) shown in the year column is consecutive for only Player 3. Player 1 did not play in the season after his second year, and Player 2 skipped a season after his third year.
Input
Below is how the output looks. Player 1 skipped a year after his 1963 season, which is why in the yrDiff column there is a 2. Player 2 played continuously from his first thru third years, so a “1” is in the yrDiff column for each of those years, but did not play in 1969, thus there is a two-year gap between 1968 and 1970. Player 3 played continuously during his two years with the team.
Output
player_data %>%
  mutate(yrDiff=ifelse (is.na( year - lag(year)),1, year - lag( year )))
In this code, dplyr is used. The mutate function will create a new variable named yrdiff. To create the value for yrdiff, it seeks both the first value in year (1962) and the previous year’s value — seeking that using lag; however, as 1962 is the first data item in the column, nothing precedes it so nothing can be subtracted from 1962. Therefore, the is.na check, which asks, “Is a previous year Not Available?”, returns TRUE. When the is.na result is true, yrDiff displays 1; whereas, when it is false, which means lag(year) found a number, yrDiff displays the year – lag(year) result.
To represent the input in R, you need the code below.
Input Code
player_data <- data.frame(player = c(1,1,1,2,2,2,2,3,3), year = c(1962,1963,1965,1966,1967,1968,1970,1971,1972))
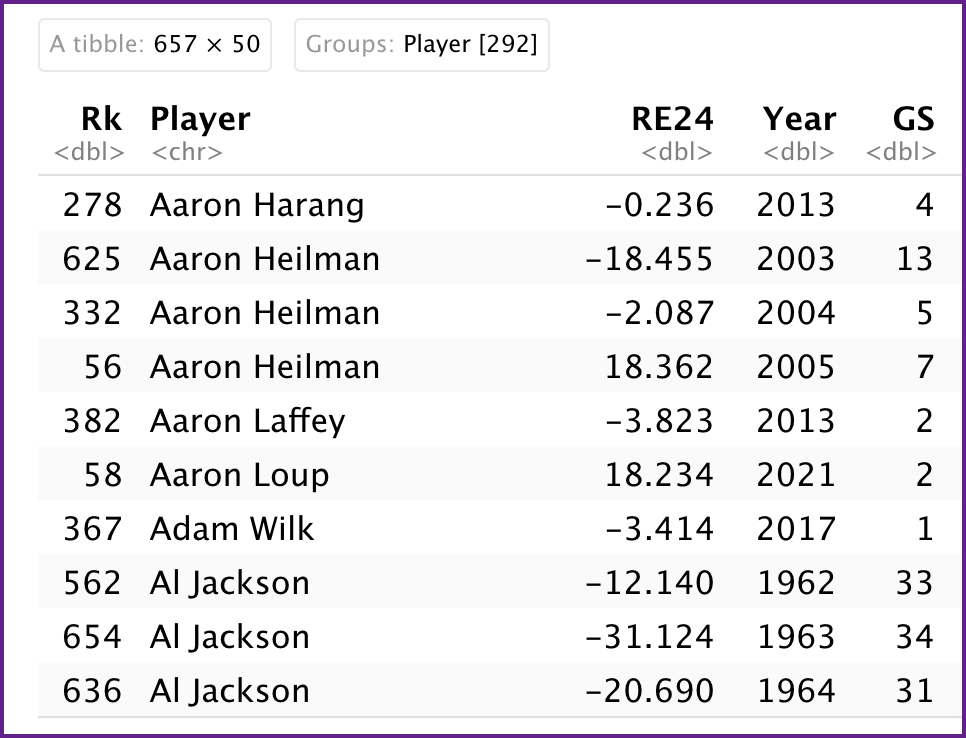
Let’s look at a real-world example. I recently investigated several baseball-related questions that shows the power of R. I obtained the data from stathead.com, formatted it in Apple Numbers, and then imported it into RStudio. The dataset contained 657 observations.
Among the results I obtained was how many games each pitcher started. This R code accomplished that:
Tom Seaver started 395 games, followed by Jerry Koosman with 346 starts and Dwight Gooden with 303. No other Mets’ pitcher had 300-plus starts.
To learn how many starts each pitcher had, I grouped each one’s data.
allStarters |>
   group_by(Player)
Two hundred ninety two pitchers were grouped by season with the years they started games arranged in ascending order. The diagram below contains a sample of part of one output display.
Next, I included the previously discussed mutate code to determine for each pitcher which years were consecutive.
In the first yrDiff column for Al Jackson, the “1” means that he started games in 1965 and that 1965 was either the first season he started for the Mets or that he also started games in 1964; whereas, the “3” in the yrDiff column for 1968 means that it had been three seasons since he last started a Mets game.
R is a great tool for those interested in doing the statistical analysis of baseball data. To use R effectively, there is a lot to learn; however, I have found the payoff to be well worth the effort expended to get it.
1 It is assumed that you have had some interaction with R or another programming language.
To win a baseball game, a team needs to outscore its opponents. To do that, it needs to prevent the other team from scoring as many runs as it does. The leader of the prevention part is the pitcher.
No batter leads the offense the same way that a pitcher leads the defense. He — and the catcher — are involved in the most plays in a game, but the pitcher plays a bigger role because what he does initiates the majority of a game’s plays.
A measure of a pitcher’s success in limiting other teams’ run scoring isthe RE24 stat. An RE24 of zero means the player is average. On some websites, the higher a pitcher’s RE24, AKA run value, the better the pitcher performed, so a value of +24 would be much better than -24.
Sites that express it that way are Baseball Reference, FanGraphs, and Stathead with Baseball Reference now calling the RE24 for pitchers “Base-Out Runs Saved“; whereas, on other sites, such as Baseball Savant, it is the opposite: the lower a pitcher’s run value, the better. A value of -24 would be much better than +24.
Further, the complexity of the RE24 calculation has increased substantially since its early days when it was based on just base/out states and outs. For example, today on Baseball Savant, there is a Pitch Arsenal Stats Leaderboard giving a pitcher’s run value based on pitch type (e.g., changeup) “and on the runners on base, out, [and] ball and strike count,” and a Swing & Take Leaderboard giving for a pitcher a run value based on a pitch’s “outcome (ball, strike, home run, etc).”
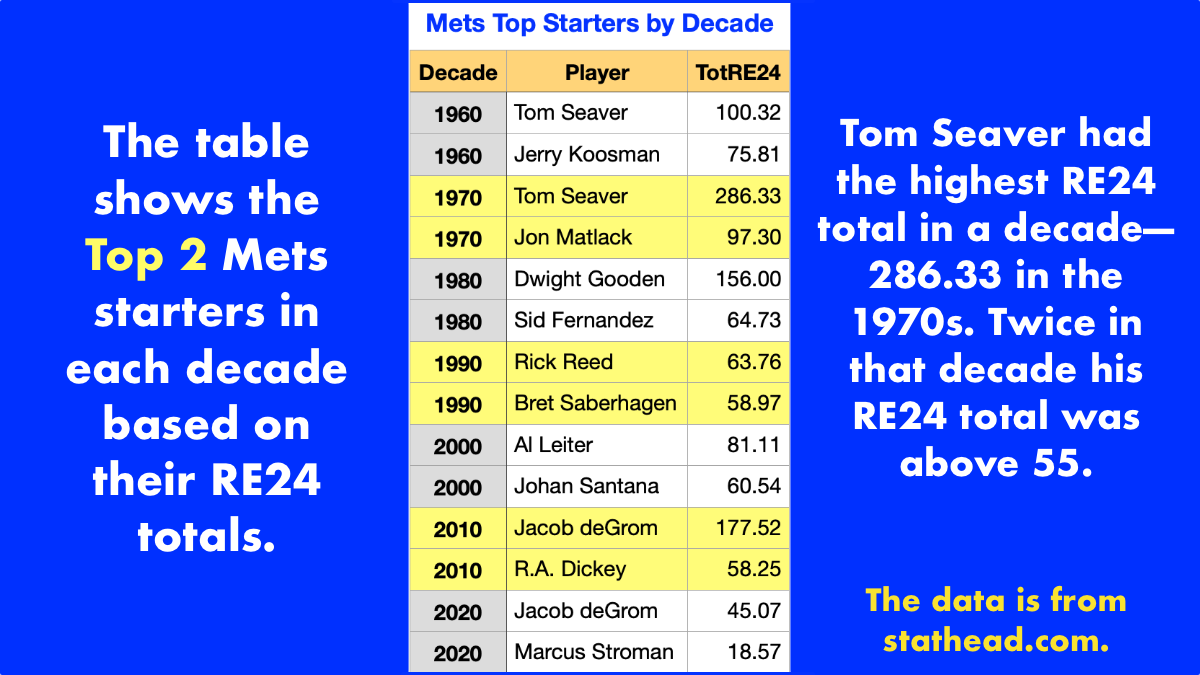
In the chart below, the Mets top two starters in each decade based upon their RE24 totals (base-out state) in that decade are shown. The decade leaders are Tom Seaver (twice), Dwight Gooden, Rick Reed, Al Leiter, and (so far in this decade) Jacob deGrom (twice). Those five would make a starting rotation that few Mets fans would complain about.
The second-place finishers include Jerry Koosman, Jon Matlack, Sid Fernandez, Bret Saberhagen, Johan Santana, R. A. Dickey, and Marcus Stroman. Further, Matlack had a higher RE24 than did the first-place finisher in two other full decades: the 1990s and 2000s. Even the second-place finishers would make a strong starting rotation.
One pitcher yet to throw a pitch for the Mets, but who is now a member of the team, Max Scherzer, has in his 14 years in Major League Baseball accumulated an RE24 of 318.5. In that timespan, only two other pitchers have accumulated a higher RE24: Justin Verlander is at 327.22, and Clayton Kershaw is at 431.64.
And in the decade from 2010 to 2019, Scherzer remains in third place with Jacob deGrom in eighth and Carlos Carrasco 33rd.
The Mets have had a lot of players behind the plate, “the game’s most demanding position,” according to Jesse Yomtov, starting with Hobie Landrith who, on April 11, 1962, caught the first pitch thrown by a Mets’ starter (Roger Craig).
Five catchers have stood out.
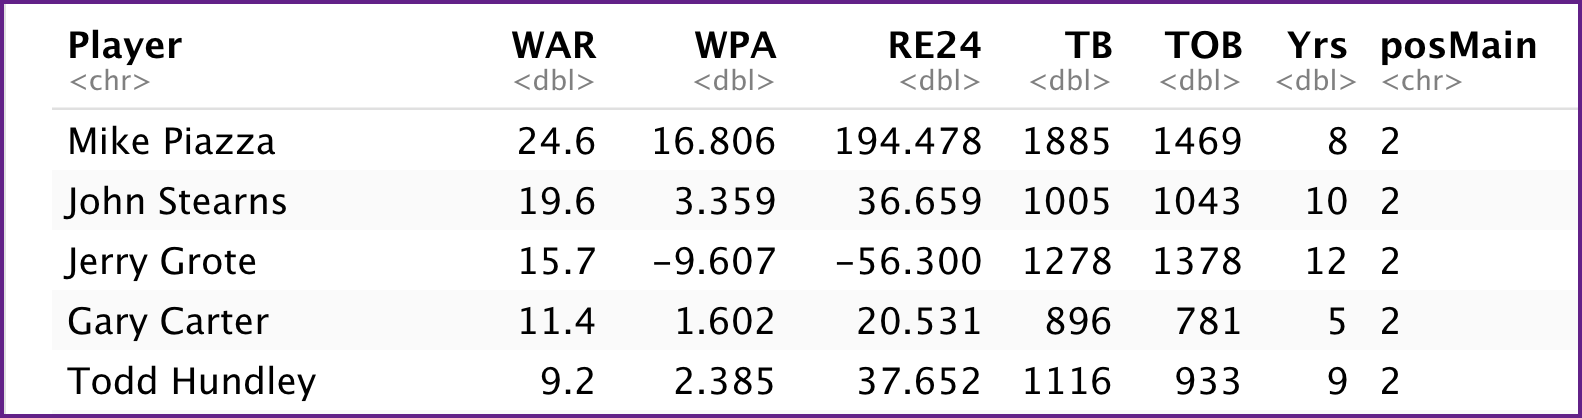
To choose them, five statistics were primarily used: WAR, WPA, RE24, Total Bases, and Times on Base (excluding by error) with WAR and WPA the two dominant ones in that order. In addition, their selection was based solely on their time with the Mets, not on their overall career, as a player could have played for multiple teams
Among the Mets top five catchers, two are in the Hall of Fame: Mike Piazzaand Gary Carter. Piazza played eight seasons for the Mets after playing seven on the Dodgers, Carter five after playing 11 for Montreal. Filling out the list are Jerry Grote, who played 12 seasons in the Big Apple, John Stearns, who played 10, and Todd Hundley, who played nine.
Sources: Stathead Baseball and Baseball Reference
Grote came closest to Piazza in Times on Base, only 91 apart; however, as a Met, Grote played four more seasons than Piazza who averaged getting on base 183.6 times a season versus 114.8 for Grote.
Based only on their Mets WAR number, the top two are Piazza and Stearns; however, when WPA and RE24 are taken into account, the difference between the two becomes quite significant. And Piazza separates himself even more from the others in Total Bases, having 607 more than the second-most — Grote’s 1278. But then, in his Mets career, Piazza amassed a .542 SLG. No one else in the group came within 100 points of that number.
Piazza had the third-highest JAWS rating among all catchers.
Twitter Poll
I found the tweet below after I completed the above write-up and was not surprised by Piazza’s landslide victory. He was one of the Mets most popular players.
Fun project at MLB dot com. Over the coming weeks, we're constructing an "all-time team" for every franchise, with input from you.
We'll start with an easy one: Who is the best catcher in Mets history?
Another stat, TOB/TB, helps lengthen Piazza’s lead over the rest of the field. Written about in 2016 by Rob Mains, the TOB/TB Number is calculated using this formula:
Multiply Times on Base by Total Bases.
Double it.
Divide the result by the sum of Times on Base and Total Bases.
Piazza’s TOTtb number of 1,651 was 325 points ahead of Grote’s with the average for the top five catchers 1,170.
Others’ Views
Tim Boyle, in his catcher comparison, made this comment about Mike Piazza:
“Piazza didn’t have a reputation for playing well defensively. As the years went on, he got worse. I’m not so sure anyone holds this against him. Piazza was far too amazing at the plate for anyone to criticize him for his weaknesses behind it.”
In contrast, Jennifer Khedaroo viewed Piazza’s defensive skill differently, writing
“In terms of defense, Piazza played well year after year. He was consistently in the top five for putouts, assists, double plays turned and runners caught stealing.”
And though Harold Friend agreed that Piazza was a better hitter than Gary Carter, he still pushed Piazza into second place among the best Mets catchers, Carter’s defensive skill giving him the edge:
“Gary Carter was the most valuable Mets catcher. Piazza will always be rated as the greater player, but Carter was more valuable to the Mets. Gary Carter was (and is) a world champion.
Piazza was the greatest hitting catcher ever. Although he was a good defensive player his first few seasons with the Los Angeles Dodgers, he was a defensive liability during his tenure with the Mets.”
Overall, Friend wrote, “Carter provided great defense, handled an excellent pitching staff magnificently and was a timely clutch hitter.”
In response to Friend, in my opinion the best measure of clutch hitting is WPA. For that stat, Piazza’s score was more than 10 times higher than Carter’s.
With regard to Piazza’s ability behind the plate, in an nj.com article, its author, Brendan Kuty, wrote that Hall of Famer Tom Glavine “said Piazza’s reputation as a bad defensive catcher is undeserved.”
“He did a lot of things well behind the plate,” Glavine said. “Yeah, he wasn’t the greatest thrower. That unfortunately translated into people thinking that some of this other game wasn’t as good as it was. He called a good game. He received the ball fine. He blocked balls fine.
But so often catchers are defined defensively on how well they throw and there’s much more that goes into just being a good defensive catcher than being able to throw. That aspect of his game, for whatever reason, garnered the extra attention and overshadowed the other aspects of his game.” (from Kuty article)