Unpuzzling R: Consecutive Years

When doing a statistical analysis involving baseball, I needed to find out for how many consecutive years a player has played for a team. In this article, I reveal one way of doing that using R. One of the R programming language’s amazing capabilities is how much you can accomplish with just a small amount of code1.

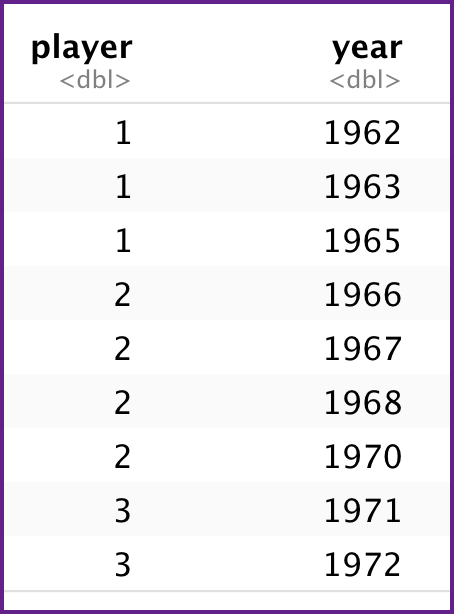
In the diagram below, data is shown for three players. The stint (number of years) shown in the year column is consecutive for only Player 3. Player 1 did not play in the season after his second year, and Player 2 skipped a season after his third year.

Input

Below is how the output looks. Player 1 skipped a year after his 1963 season, which is why in the yrDiff column there is a 2. Player 2 played continuously from his first thru third years, so a “1” is in the yrDiff column for each of those years, but did not play in 1969, thus there is a two-year gap between 1968 and 1970. Player 3 played continuously during his two years with the team.

Output

player_data %>% 
  mutate(yrDiff=ifelse (is.na( year - lag(year)),1, year - lag( year )))

In this code, dplyr is used. The mutate function will create a new variable named yrdiff. To create the value for yrdiff, it seeks both the first value in year (1962) and the previous year’s value — seeking that using lag; however, as 1962 is the first data item in the column, nothing precedes it so nothing can be subtracted from 1962. Therefore, the is.na check, which asks, “Is a previous year Not Available?”, returns TRUE. When the is.na result is true, yrDiff displays 1; whereas, when it is false, which means lag(year) found a number, yrDiff displays the year – lag(year) result.

To represent the input in R, you need the code below.

Input Code

player_data <- data.frame(player = c(1,1,1,2,2,2,2,3,3), year = c(1962,1963,1965,1966,1967,1968,1970,1971,1972))

Let’s look at a real-world example. I recently investigated several baseball-related questions that shows the power of R. I obtained the data from stathead.com, formatted it in Apple Numbers, and then imported it into RStudio. The dataset contained 657 observations.

Among the results I obtained was how many games each pitcher started. This R code accomplished that:

allStarters |>
  group_by(Player) |>
  summarize(SumSt = sum(GS)) |>
  arrange(desc(SumSt))

Tom Seaver started 395 games, followed by Jerry Koosman with 346 starts and Dwight Gooden with 303. No other Mets’ pitcher had 300-plus starts.

To learn how many starts each pitcher had, I grouped each one’s data.

allStarters |>
   group_by(Player)

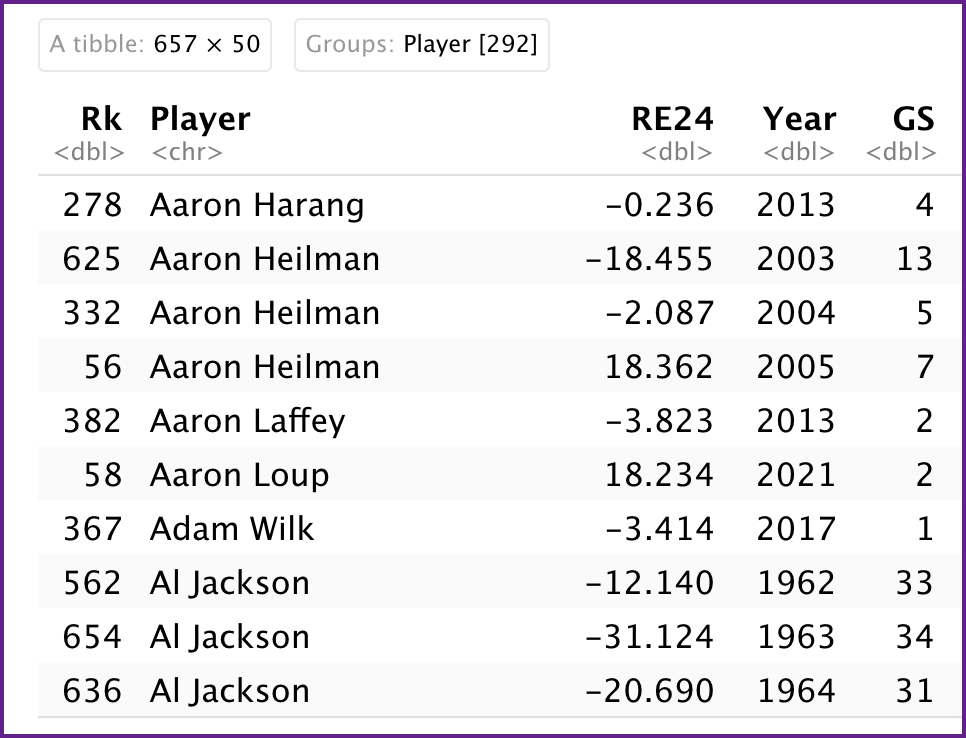
Two hundred ninety two pitchers were grouped by season with the years they started games arranged in ascending order. The diagram below contains a sample of part of one output display.

Next, I included the previously discussed mutate code to determine for each pitcher which years were consecutive.

allStarters |>
   arrange(Player, Year) |>
   group_by((Player)) |>
   mutate(yrDiff=ifelse(is.na(Year - lag(Year)),1,Year - lag(Year))) |>
   relocate(yrDiff, .after = Year)

Here is a sample of that code’s output:

In the first yrDiff column for Al Jackson, the “1” means that he started games in 1965 and that 1965 was either the first season he started for the Mets or that he also started games in 1964; whereas, the “3” in the yrDiff column for 1968 means that it had been three seasons since he last started a Mets game.

R is a great tool for those interested in doing the statistical analysis of baseball data. To use R effectively, there is a lot to learn; however, I have found the payoff to be well worth the effort expended to get it.


1 It is assumed that you have had some interaction with R or another programming language.

Exploring Baseball with R #1

Every year since 1956 at least one pitcher has won the Cy Young Award starting with the Brooklyn Dodgers’ Don Newcombe. Many questions can be asked. How many pitchers won the award more than once? Which pitchers achieved that feat? Who won it the most times?

In this post, I focus on just one question: How many players won the Cy Young Award? I will share how I got the answer using the R programming language. I will also be using both RStudio and Sean Lahman’s Baseball Database, an excellent resource. A basic familiarity with both R, dplyr, and RStudio is assumed. (Note: As you progress through this post, have RStudio open.)

Here is an introduction to the database.

The database contains multiple files in table format. The table containing the player awards data is AwardsPlayers.RData. It has six variables:

playerID       Player ID code
awardID        Name of award won
yearID         Year
lgID           League
tie            Award was a tie (Y or N)
notes          Notes about the award

What AwardsPlayers.RData does not have are the players’ names though it has each Player’s ID. Their names are in People.RData. The People table contains 24 variables. In the partial display of its variables, notice that it too contains playerID.

playerID       A unique code asssigned to each player.
birthYear      Year player was born
birthMonth     Month player was born
birthDay       Day player was born
birthCountry   Country where player was born
birthState     State where player was born
birthCity      City where player was born
nameFirst      Player's first name
nameLast       Player's last name
weight         Player's weight in pounds
height         Player's height in inches
bats           Player's batting hand (left, right, or both)        
throws         Player's throwing hand (left or right)

Fortunately, the playerID field links together the data in the tables.

For this tutorial, you need to download from Lahman’s database the “2019 – R Package“. When the webpage appears, click “data.”

You will see a list of downloadable files. The files are in RData format, a format created for use in R. For this tutorial, download these two files: AwardsPlayers.RData and People.RData. The latter is not shown in the image below, which contains a partial file list.

After you click AwardsPlayers.RData, what is shown below will appear. Click View Raw. The file will download to your device. (Note: The way I show you to do something in this tutorial is often not the only way to do it.)

Click the downloaded file, which in this case is AwardsPlayers.RData. On my Mac, it downloaded into the Downloads folder.

When this appears, click Yes.

This should appear in your RStudio Console:

load(“/Users/Home/Downloads/AwardsPlayers.RData”

Here is how the AwardsPlayers.RData looks in RStudio’s Global Environment. It is now available for you to work on.

Now, in RStudio the two downloaded tables are R data frames. Next, I created an R Markdown file and made copies of both data frames.

AP <- AwardsPlayers
P <- People

Merge AP and P into a new data frame: AP_P. The column common to both, playerID, serves as the link.

AP_P <- merge(AP, P, by="playerID")

View the merged data frame’s variables.

glimpse(AP_P)

To view the data, while in the Console type

View(AP_P).

Activate the Tidyverse library, reduce the number of columns, and display the last 10 rows. Note: If you have not used it before, you may need to install it using the R code on the next line.

install.packages("tidyverse")
library(tidyverse)
AP_P %>% select(nameFirst, nameLast, playerID, yearID, awardID) %>% tail(10)

Select five columns in AP_P, and display the last 10 rows in AP_P.

  nameFirst<chr>nameLast<chr>playerID<chr>yearID<int>awardID<chr>
6227RyanZimmermanzimmery012010Silver Slugger
6228RyanZimmermanzimmery012011Lou Gehrig Memorial Award
6229RyanZimmermanzimmery012009Silver Slugger
6230RichieZiskziskri011981TSN All-Star
6231RichieZiskziskri011974TSN All-Star
6232BarryZitozitoba012012Hutch Award
6233BarryZitozitoba012002Cy Young Award
6234BarryZitozitoba012002TSN Pitcher of the Year
6235BarryZitozitoba012002TSN All-Star
6236BenZobristzobribe012016World Series MVP

The next step is to combine the nameFirst and nameLast columns in a new column, fullname. The paste function automatically inserts a space between the names.

AP_P$fullname <- paste(AP_P$nameFirst, AP_P$nameLast)

The five columns to be displayed are selected and the last 15 observations in the AP_P data frame are displayed.

AP_P %>% select(playerID, fullname, awardID, yearID, lgID) %>% tail(15)
zimmery01Ryan ZimmermanLou Gehrig Memorial Award2011ML
zimmery01Ryan ZimmermanSilver Slugger2009NL
ziskri01Richie ZiskTSN All-Star1981AL
ziskri01Richie ZiskTSN All-Star1974NL
zitoba01Barry ZitoHutch Award2012ML
zitoba01Barry ZitoCy Young Award2002AL
zitoba01Barry ZitoTSN Pitcher of the Year2002AL
zitoba01Barry ZitoTSN All-Star2002AL
zobribe01Ben ZobristWorld Series MVP2016ML
In this table only the last eight observations are shown.

Go into the View window and set the settings you see below in the first row. Notice that the last year for the Cy Young Award is 2017, thus two years are missing.

Partial screenshot of View window

Add the missing data to the AP dataset.

AP <- add_row(AP, playerID = "degroja01", awardID = "Cy Young Award", yearID = 2018, lgID = "NL", tie = "NA", notes = "P")
AP <- add_row(AP, playerID = "snellwa01", awardID = "Cy Young Award", yearID = 2018, lgID = "AL", tie = "NA", notes = "P")
AP <- add_row(AP, playerID = "degroja01", awardID = "Cy Young Award", yearID = 2019, lgID = "NL", tie = "NA", notes = "P")
AP <- add_row(AP, playerID = "verlaju01", awardID = "Cy Young Award", yearID = 2019, lgID = "AL", tie = "NA", notes = "P")
AP <- add_row(AP, playerID = "verlaju01", awardID = "TSN All-Star", yearID = 2019, lgID = "AL", tie = "NA", notes = "P")
AP <- add_row(AP, playerID = "snellwa01", awardID = "TSN All-Star", yearID = 2018, lgID = "AL", tie = "NA", notes = "P")

Exercise: Update the AP_P data frame with the new data added to the AP dataset.

How many players won the Cy Young Award? After piping what is in the AP_P data frame to the select function, we filter it to limit the observations just to those players who won the Cy Young Award. That result is then sorted (in ascending order) and the number of observations in the awardID column are counted.

AP_P %>% select(playerID, fullname, yearID, lgID, awardID) %>% filter(awardID == "Cy Young Award") %>% arrange(yearID) %>% count(awardID)

Through 2019, 118 players have won the Cy Young.

If you find any errors in this post, please let me know. If you have any technical questions about R, please ask them on stackoverflow.com.