In 2018, Dave Sheinin wrote about a hitting change in Major League baseball. More hitters, he said, were becoming “becoming launch-angle disciples.”
More batters are focusing not only on hitting the ball hard, but hitting the ball high into the air. The average launch angle — the angle at which the ball flies after being hit — rose from 10.5 degrees in 2015 to 11.5 degrees in 2016.
Dave Sheinin — https://www.washingtonpost.com/graphics/sports/mlb-launch-angles-story/
To counter that change, pitchers responded by throwing “fewer sinkers, fewer low pitches, more breaking balls, more four-seam fastballs, more high pitches.”
Their pitches were elevating.
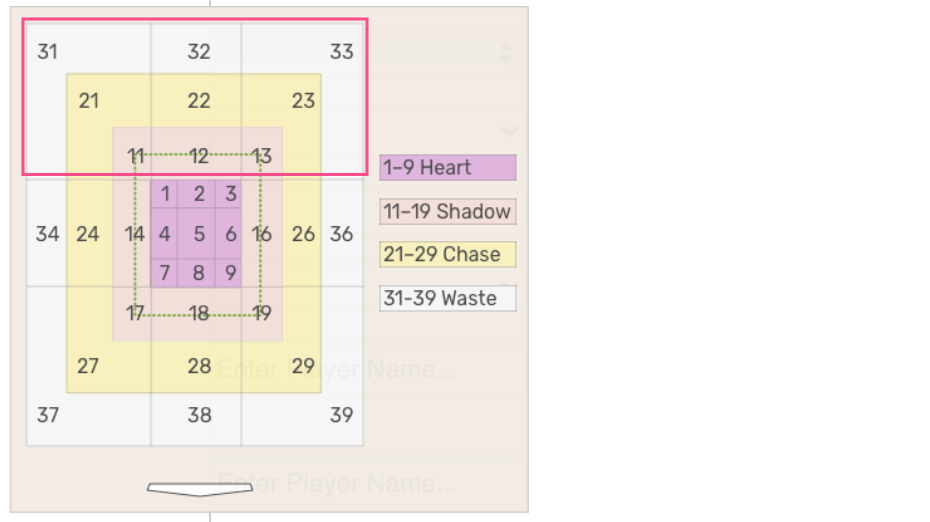
Using Statcast Search, I first investigated how many pitches in 2019 were in the upper portion of the Attack Zones. The graphic below from baseballsavant.com shows the nine zones in the “high-ball” area, zones 11-13, 21-23, and 31-33. All are above the heart zone, which is lavender-colored. The heart zone pictures the heart of the plate.

The first question to be researched is From 2017 to 2019, how many pitches were thrown in the “high-ball” area?
To answer it, these Statcast Settings were used:
- Player Type: Pitcher
- Group By: League and Year
- Attack Zones: 11, 12, 13, 21, 22, 23, 31, 32, 33
- Season: 2017, 2018, 2019
- Season Type: Regular
| Year | Pitches | Total | Pitch % | |||
| 1 | League | 2019 | 123003 | 732473 | 16.8 | |
| 2 | League | 2018 | 115944 | 721190 | 16.1 | |
| 3 | League | 2017 | 111112 | 721243 | 15.4 |
Since 2017, the percentage of high-ball pitches increased from 15.4% to 16.8% as the number increased by 11,891. An unexpected result is that the total number of pitches also increased from 2017 to 2019 by 11,230, but that is a topic for another post.
Throwing balls high has its risks.
Sheinen’s article includes this Bud Black quote:
“It’s still dangerous throwing the ball up in the zone. That hasn’t changed,” said Colorado Rockies Manager Bud Black, a former pitcher. “You have to throw it at the right height. If you throw it too high they’ll take it [for a ball], but if you miss it low, they’ll crush it. It isn’t for everybody. There are pitchers whose style and stuff allows them to pitch up there, guys we identify as highball pitchers, and we encourage them.”
That led to the second question: In 2019 which pitchers took that risk the most and what were the results?
Revised Statcast Search Settings
- Player Type: Pitcher
- Group By: Player Name
- Attack Zones: 11, 12, 13, 21, 22, 23, 31, 32, 33
- Season: 2019
- Season Type: Regular
Here are the top 10 pitchers in 2019 ordered by number of high-ball pitches they threw.
| Player | Pitches | Total | Pitch % |
| Trevor Bauer | 875 | 3687 | 23.7 |
| Gerrit Cole | 869 | 3362 | 25.8 |
| Jake Odorizzi | 826 | 2787 | 29.6 |
| Rick Porcello | 793 | 2960 | 26.8 |
| Steven Matz | 745 | 2702 | 27.6 |
| Justin Verlander | 745 | 3448 | 21.6 |
| Caleb Smith | 743 | 2661 | 27.9 |
| Reynaldo Lopez | 708 | 3163 | 22.4 |
| Jacob deGrom | 699 | 3297 | 21.2 |
| Jordan Lyles | 698 | 2456 | 28.4 |
Minnesota Twins starter Jake Odorizzi led the Top 10 in high-ball percent, nudging 30%. Last season, he also had his personal bests in won-lost percentage (.682), strikeouts per nine innings (10.1), and wins (15). Surprisingly, his 2019 Pitch % of 29.6% was not his career high. In 2017 with the Rays it was 30.3%; however, his won-lost record was 10-8, so just keeping pitching high may not have been the main cause of his increased success in 2019. But that too is a topic for another post’s investigation.
Given that in 2019 Odorizzi’s improved by 114% the number of games he won in the previous season, did the other members of the Top 10 experience a similar gain?
Eight of the Top 10 won more games in 2019 than in 2018, Trevor Bauer failing to match his 2018 win total by one game though he started six more games, a league switch likely the cause. He had a winning record with the Indians, but then a losing one with the Reds. In addition, Rick Porcello had three fewer wins in 2019 though starting only one fewer games.
| Player | 2018 | 2019 |
| Trevor Bauer | 12-6 | 11-13 |
| Gerrit Cole | 15-5 | 20-5 |
| Jake Odorizzi | 7-10 | 15-7 |
| Rick Porcello | 17-7 | 14-12 |
| Steven Matz | 5-11 | 11-10 |
| Justin Verlander | 16-9 | 21-6 |
| Caleb Smith | 5-6 | 10-11 |
| Reynaldo Lopez | 7-10 | 10-15 |
| Jacob deGrom | 10-9 | 11-8 |
| Jordan Lyles | 3-4 | 12-8 |