The Mets Aren’t Just Losing — They’re Losing Wrong

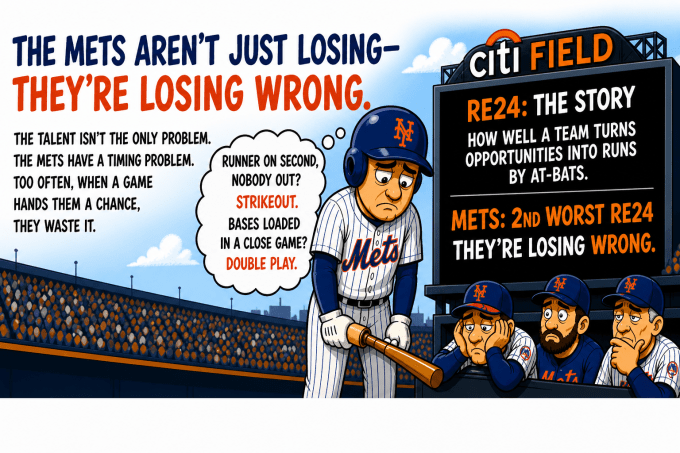
The New York Mets have a talent problem. But a single baseball stat reveals something more painful — they have a timing problem. Too often this season, when a game hands them a chance to do damage, they waste it. Runner on second, nobody out? Strikeout. Bases loaded in a close game? Double play.

The statistic that captures this is RE24.

RE24 measures how well a team turns opportunities into runs. Right now, the Mets have the second-worst RE24 in baseball.

According to FanGraphs on May 5, 2026, the Mets team RE24 was -36.36. Only the Giants had a lower one. In contrast, the Yankees lead the majors with a 44.70 RE24 score.

It’s not just coincidence that the Yankees lead the AL East while the Mets are last in the NL East and the Giants are next-to-last in the NL West.

So what is RE24?

At any moment in a game, there are 24 possible base-out situations from no outs, no runners on base to two outs, bases loaded. Each carries an expected number of runs a team should score in a particular base/out instance before the inning ends— a concept Tom Tango developed and popularized.

For example
Nobody on, nobody out → ~0.5 runs
Bases loaded, nobody out → ~2.33 runs
Runner on second, two outs → ~0.33 runs

Be aware that when a plate appearance makes a scoring situation worse, it lowers a team’s RE24.

RE24 asks a simple question: when the situation changes, did you add value or give it away? Over time, that answer becomes a record of execution.

Mediocre production. Outsized damage.

The Mets aren’t among the worst teams at getting on base in these spots. Their average and on-base percentage with runners on rank in the low 20s league-wide — poor, but not disastrous.

This isn’t just lack of talent. It’s how the at-bats end.

The Mets are “losing wrong” because they aren’t just losing—they are wasting their own chances. Even when they get players on base, they constantly make the worst possible outs—like hitting into double plays—which kills their momentum and stops them from scoring. Basically, they are losing games because too often they hurt their own chances every time the opportunity presents itself for them to gain on their opponent.

Why this matters

Underperforming teams don’t take advantage of chances.

At 13–22, the Mets are not just struggling — they’re consistently missing out on opportunities.

That’s harder to watch than being outplayed, because the runs you hoped would score never make it to the scoreboard.

Mets Best Starters by Decade

To win a baseball game, a team needs to outscore its opponents. To do that, it needs to prevent the other team from scoring as many runs as it does. The leader of the prevention part is the pitcher.

No batter leads the offense the same way that a pitcher leads the defense. He — and the catcher — are involved in the most plays in a game, but the pitcher plays a bigger role because what he does initiates the majority of a game’s plays.

A measure of a pitcher’s success in limiting other teams’ run scoring is the RE24 stat. An RE24 of zero means the player is average. On some websites, the higher a pitcher’s RE24, AKA run value, the better the pitcher performed, so a value of +24 would be much better than -24.

Sites that express it that way are Baseball Reference, FanGraphs, and Stathead with Baseball Reference now calling the RE24 for pitchers “Base-Out Runs Saved“; whereas, on other sites, such as Baseball Savant, it is the opposite: the lower a pitcher’s run value, the better. A value of -24 would be much better than +24.

Further, the complexity of the RE24 calculation has increased substantially since its early days when it was based on just base/out states and outs. For example, today on Baseball Savant, there is a Pitch Arsenal Stats Leaderboard giving a pitcher’s run value based on pitch type (e.g., changeup) “and on the runners on base, out, [and] ball and strike count,” and a Swing & Take Leaderboard giving for a pitcher a run value based on a pitch’s “outcome (ball, strike, home run, etc).”

In the chart below, the Mets top two starters in each decade based upon their RE24 totals (base-out state) in that decade are shown. The decade leaders are Tom Seaver (twice), Dwight Gooden, Rick Reed, Al Leiter, and (so far in this decade) Jacob deGrom (twice). Those five would make a starting rotation that few Mets fans would complain about.

The second-place finishers include Jerry Koosman, Jon Matlack, Sid Fernandez, Bret Saberhagen, Johan Santana, R. A. Dickey, and Marcus Stroman. Further, Matlack had a higher RE24 than did the first-place finisher in two other full decades: the 1990s and 2000s. Even the second-place finishers would make a strong starting rotation.

One pitcher yet to throw a pitch for the Mets, but who is now a member of the team, Max Scherzer, has in his 14 years in Major League Baseball accumulated an RE24 of 318.5. In that timespan, only two other pitchers have accumulated a higher RE24: Justin Verlander is at 327.22, and Clayton Kershaw is at 431.64.

And in the decade from 2010 to 2019, Scherzer remains in third place with Jacob deGrom in eighth and Carlos Carrasco 33rd.

One of My Favorite Baseball Stats: RE24

One of my favorite baseball stats is one developed by sabermetrician Tom Tango and well explained by Patrick Jeter of Redleg Nation. It’s RE24, where “RE” stands for “Run Expectancy” and RE24 for “Run expectancy based on the 24 base-out states.”

In brief, it indicates how many runs, on average, a team can expect to score in an inning depending on the number of outs and which bases are occupied. For example, if a batter’s at the plate with the bases loaded and no outs, from that point to the inning’s end his team can expect to score more runs than if the same batter came to the plate with none on and the bases empty. Continue reading “One of My Favorite Baseball Stats: RE24”