New York Mets All-Star Game Participation

This season, three Mets have been selected for the 90th All-Star game: Jacob deGrom, Jeff McNeil, and Pete Alonso, which is more than in 2017 and 2018 combined. In 2017 and in 2018 only one Met was chosen. Further, though McNeil has played multiple positions this season, he is listed on the All-Star roster as a second baseman, a position he has played only 22 times: in 2019, he has primarily played in 2019 in the outfield.

Since the Mets began in 1962, the team’s players have been selected for the All-Star team 121 times. The first Mets player selected, in 1962, was Richie Ashburn. In that year there were two All-Star games, one on July 10, which the National League won, and the other on July 30, which the American League won. Ashburn did not start in either game. Willie May started in centerfield in both games. He did not play in the first game, but in the second game, as a pinch-hitter, he singled in the seventh inning and scored a runner. 1962 All-Star Game Box Score by Baseball Almanac

Only four Mets have started an All-Star game in centerfield: Willie Mays in 1972, Lance Johnson in 1996, and Carlos Beltran twice, in 2007 and 2008. In the 1996 game, Johnson had 3 hits in 4 at-bats. That season, he led the National League in hits with 227, in 1996, in singles with 166, and in triples with 21. Despite his great season with the Mets, in August 1997 they traded him to the Cubs along with Mark Clark and Manny Alexander for Brian McRae, Mel Rojas, and Turk Wendell.

Besides Beltran, only 28 other Mets were selected for the All-Star game more than once while playing for the Mets. Leading the group is Tom Seaver who appeared in nine games. Among the others selected multiple times are Mike Piazza, Darryl Strawberry, and David Wright, all selected seven times.

The most Mets selected in one season to the All-Star team is six. That occurred in 2006. Somewhat surprisingly, during the 1969 season only three Mets made the All-Star team — Cleon Jones, Jerry Koosman, and Tom Seaver and, the following season, only two made it — Bud Harrelson and Tom Seaver.

Finally, whereas four Mets pitchers have started an All-Star game, only one first baseman did, Keith Hernandez, one second baseman, Ron Hunt, two shortstops, Bud Harrelson, and Jose Reyes, and two third basemen, Howard Johnson and David Wright.

The table below show how many times since 1962 a Mets player has started in an All-Star game by position. The “Different” column indicates how many different players started. For example, though Mets pitchers have been the starters in All-Star games four times, one pitcher (Dwight Gooden) started twice. The other two were Tom Seaver and Matt Harvey.

All-Star Games in which Mets player started, by position

Statcast School: Barrels

Pete Alonso has quickly become one of the top power hitters in Major League Baseball, but unlike in days of old, how many homers a batter hits and how far he hits them are no longer the only measures of a slugger. Today, “barrels” has become a popular indicator.

In an article for Baseball Prospectus, Russell A. Carleton wrote that

Until Statcast, we didn’t have systematic (public) data on how hard a batter hit the ball. Now, we know how fast the ball was going when it left the bat and at what angle the ball was “launched.”

MLB defines a barrel as those

batted-ball events whose comparable hit types (in terms of exit velocity and launch angle) have led to a minimum .500 batting average and 1.500 slugging percentage since Statcast was implemented Major League wide in 2015.

Further, “To be Barreled, a batted ball requires an exit velocity of at least 98 mph,” according to MLB.

Here is MLB’s definition of a batted-ball event:

A Batted Ball Event represents any batted ball that produces a result. This includes outs, hits and errors. Any fair ball is a Batted Ball Event. So, too, are foul balls that result in an out or an error.

To start, in Statcast I sought to answer this question: Which players have hit the most barrels this season. To do the search, I used the search settings below.

Player Type: Batter
Season: 2019
Season Type: Regular Season
Quality of Contact: Barrel
Min # of Total Pitches: 25 Pitches
Sort By: Pitches
Change Total Pitch Parameters: Click “Plate Appearances.”

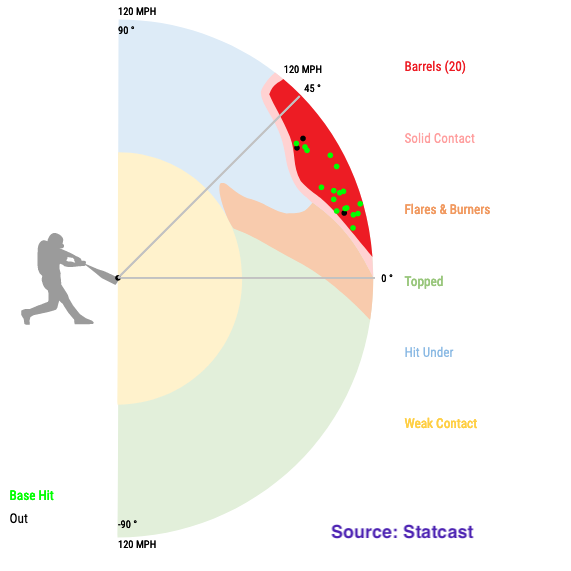
Being a Mets fan, the third name in the results drew my attention: Pete Alonso. Up to May 13 he has 20 barrels in 165 plate appearances (12.1%). The radial chart below shows the exit velocity and launch angle of each barrel. The area in red contains the barrels. To see the “live” chart, click this link.

Position your cursor over the topmost circle in the Barrels area. When you do that, the information in the image below should appear.

The three black circles indicate outs, the 17 green circles hits, so not every barreled ball is a hit. “KC” is knuckle curve.

Some other facts:

  • The average distance of Alonso’s barreled balls is 386.5 feet.
  • The average launch angle is 23.69º.
  • The average exit velocity is 109.8 mph.
  • The hardest-hit ball traveled at 118.3 mph.
  • The lowest launch angle was 12º: the result, a line drive double to left field.

Ramos needs to narrow extra-base hits gap between him and Alonso

After 24 games, Pete Alonso leads the Mets with 16 extra-base hits.

He’s also sixth in Major League Baseball with 58 total bases. Further, his .682 slugging percentage is the highest on the team and the 13th-best in Major League Baseball.

At the opposite extreme is Wilson Ramos with an 24 total bases and an SLG of .333, the 25th-lowest one out of 186 players. So far this season, he has only two extra-base hits, a double and a homer.

A Mets pitcher, Zach Wheeler, has as many extra-base hits.

Continue reading “Ramos needs to narrow extra-base hits gap between him and Alonso”