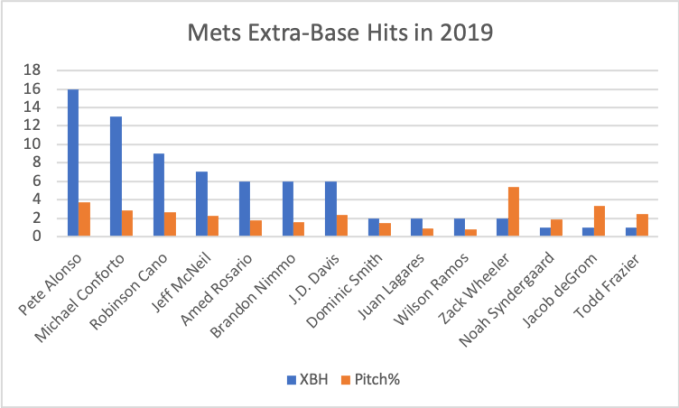
Which Mets player had the most base hits in 2019 with runners on base?
That is the research question which the table at the top of this page answers.
How to get the information in the table
(I did the search before the Mets game on May 2, 2019. As you will be doing it on a later date, your results will be different.)
Go to Statcast Search and match the settings below.
For PA (Plate Appearance) Result you have 26 choices. Group select “Base Hit” to choose all four types of hits: single, double, triple, and home run. This will appear in the PA Result box as “Homerun (4).”
For Season Type you have three choices: Regular Season, Playoffs, and Spring Training. Choose “Regular Season.”
Season: 2019
Player Type: From the 10 choices, select “Batter.”
Team: Select “Mets.”
Runners On: You have nine choices. Select “Runner On Base.”
Min # of Total Pitches: Choose 50. That will require a player to have at least 50 plate appearances (not pitches) because of the next setting. Though the row heading say “Total Pitches,” I will be overriding that so it contains plate appearances.
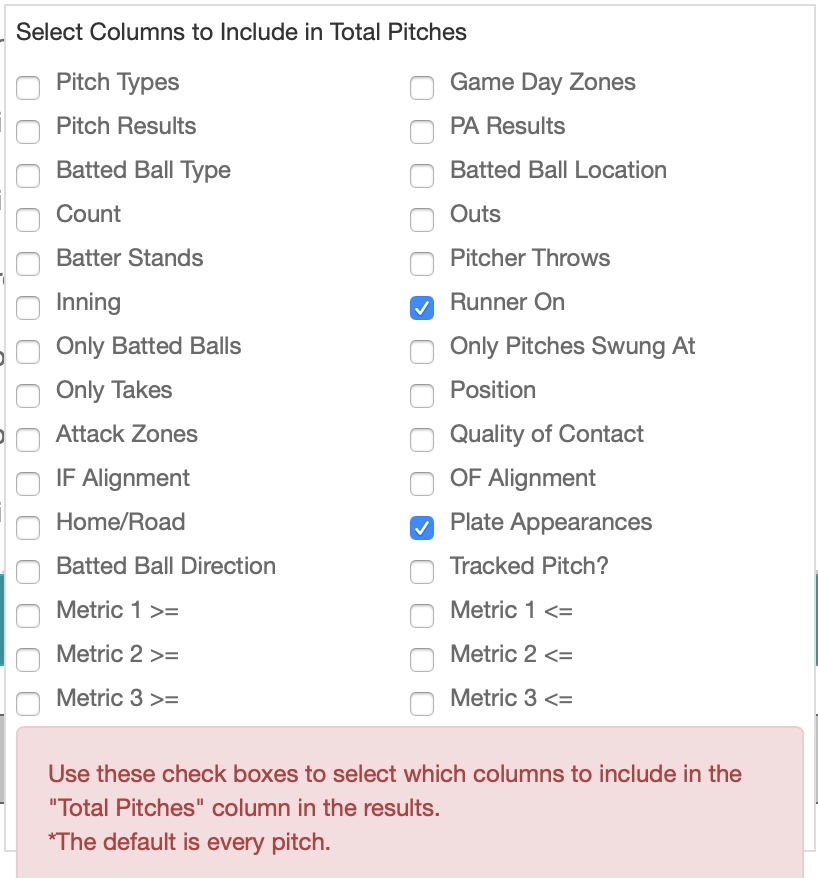
Change Total Pitch Parameters: “Check Plate Appearances.”
Note: On its bottom, The Change Total Pitch Parameters box contains these statements: (a) “Use these check boxes to select which columns to include in the ‘Total Pitches’ column in the results” and (b) “The default is every pitch.” By checking “Plate Appearances” that information will appear under the heading “Total Pitches” in the resulting table.
In addition, check “Runner On.” Then, the search result will show all the 2019 plate appearances of the Mets hitters in which there was at least one runner on base and, in them, how many base hits there were.
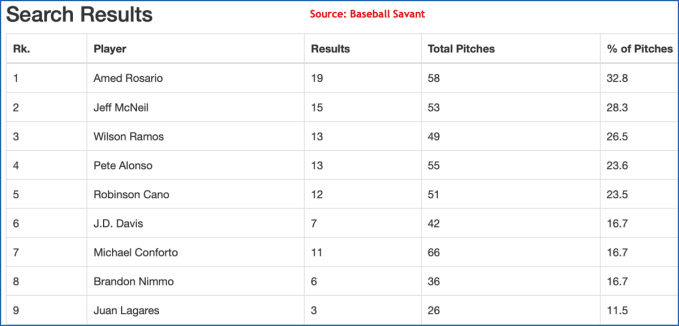
It would be preferable if “Plate Appearances” appeared instead of “Total Pitches,” but that is not what happens. To further confuse things, there is a Results column in the Results table. The Results column in this scenario contains the number of base hits. Finally, the “% of Pitches” column does not contain a pitch count. Instead, it contains the percent of plate appearances in which the player got a base hit.
Analysis of Results
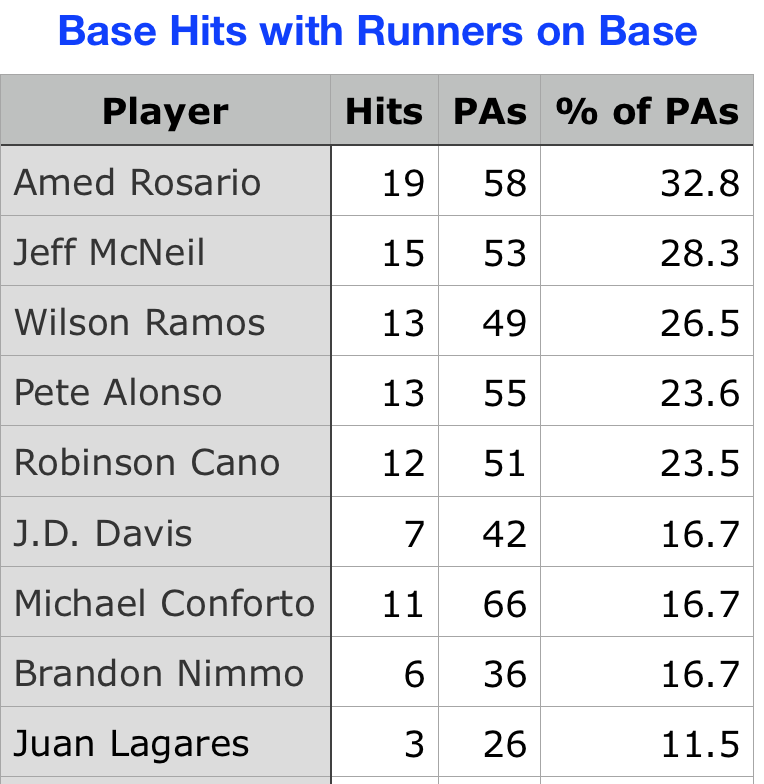
Amed Rosario has the most base hits so far in 2019 with runners on base. He came to the plate 58 times with runners on base and got a base hit in 19 of them (32.8%).
In the results table below, for clarity the column headings have been adjusted.
This link will take you the Statcast Search page that shows the Search form.
In contrast, Rosario had 58 plate appearances with no one on base and got 11 hits in them (19.0% of those plate appearances) — That data is from a different Statcast search.
Rosario had a much higher hit rate with runners on base than with none on (32.8% vs. 19.0%). Did the added pressure of “runners on” cause him to concentrate more? Did he change his hitting approach?
The next statistics are from baseball-reference.com. They were obtained on May 2, 2019 for Amed Rosario to provide independent verification of his Statcast results:

The first row in the table from Baseball Reference contains data that we have not obtained. To get Rosario’s RISP results in Statcast, two changes must be made. One is the “Runners On” row’s contents must be switched to “RISP,” but if that were the only change made, when I ran the search I would get this message: “There are no results for your search.” That’s because no Mets batter has 50 plate appearances with a runner in scoring position — it’s too early in the season. By reducing “Min # of Total Pitches” to 25 I averted the problem.
For those interested, Rosario got those 11 hits in 32.4% of his plate appearances with a runner in scoring position (34). That was the highest percentage on the team. Ramos was second, and though he also had 11 hits with RISP, he got them in 38 plate appearances (28.9%). Surprisingly, Alonso was fourth with only six hits in 26 PA (23.1%). Third best was McNeil with 10 hits in 35 PA (28.6%). Rounding out the top six was J.D. Davis with 5 hits in 29 PA (17.2%) and Conforto with 5 hits in 39 PA (12.8%).