Pete Alonso has quickly become one of the top power hitters in Major League Baseball, but unlike in days of old, how many homers a batter hits and how far he hits them are no longer the only measures of a slugger. Today, “barrels” has become a popular indicator.
In an article for Baseball Prospectus, Russell A. Carleton wrote that
Until Statcast, we didn’t have systematic (public) data on how hard a batter hit the ball. Now, we know how fast the ball was going when it left the bat and at what angle the ball was “launched.”
MLB defines a barrel as those
batted-ball events whose comparable hit types (in terms of exit velocity and launch angle) have led to a minimum .500 batting average and 1.500 slugging percentage since Statcast was implemented Major League wide in 2015.
Further, “To be Barreled, a batted ball requires an exit velocity of at least 98 mph,” according to MLB.
Here is MLB’s definition of a batted-ball event:
A Batted Ball Event represents any batted ball that produces a result. This includes outs, hits and errors. Any fair ball is a Batted Ball Event. So, too, are foul balls that result in an out or an error.
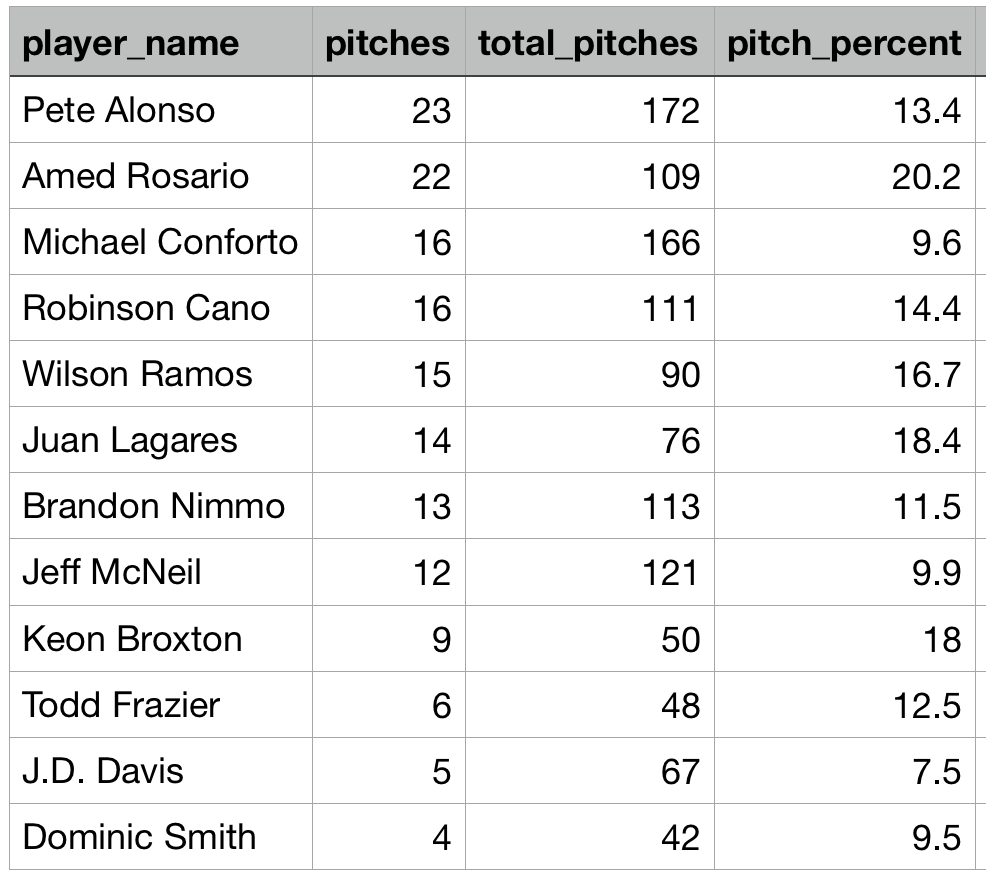
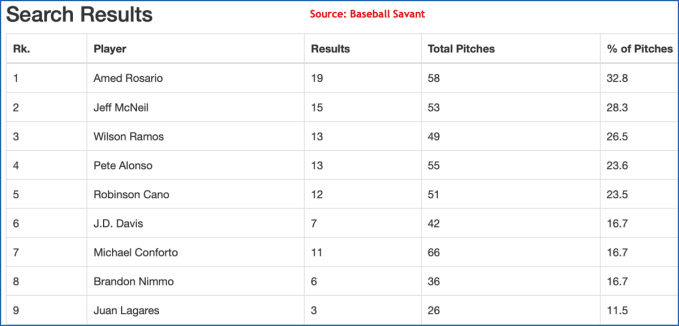
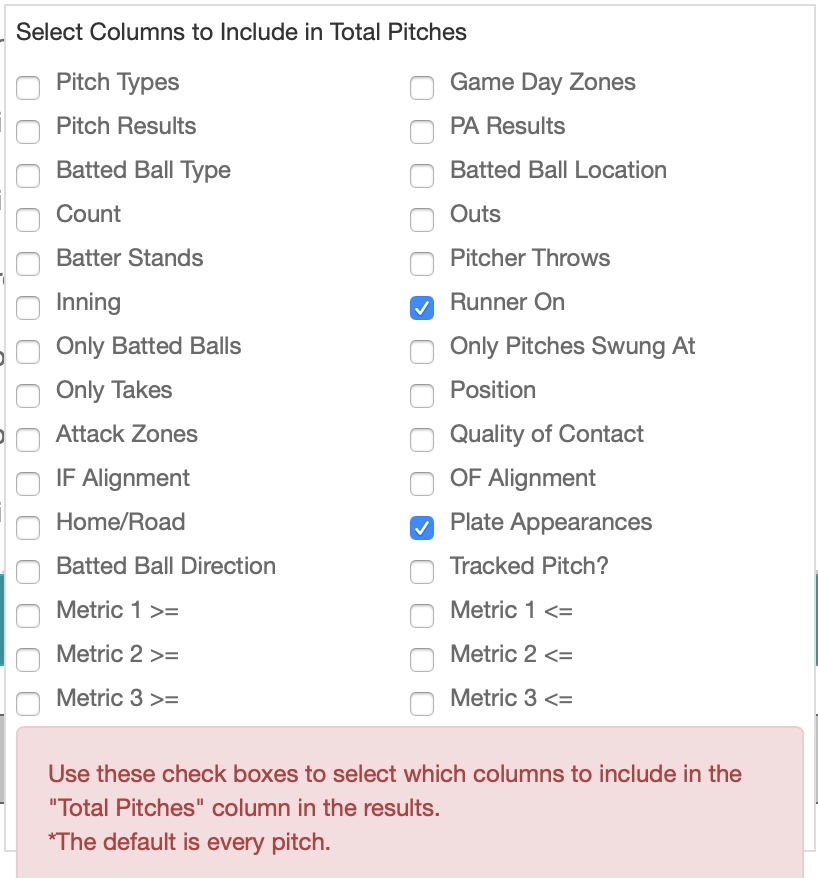
To start, in Statcast I sought to answer this question: Which players have hit the most barrels this season. To do the search, I used the search settings below.
Player Type: Batter
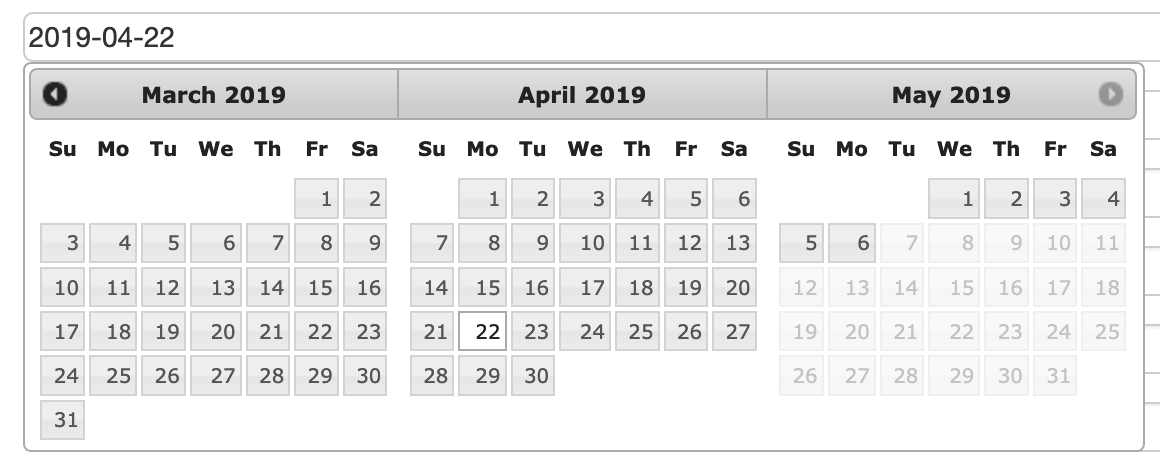
Season: 2019
Season Type: Regular Season
Quality of Contact: Barrel
Min # of Total Pitches: 25 Pitches
Sort By: Pitches
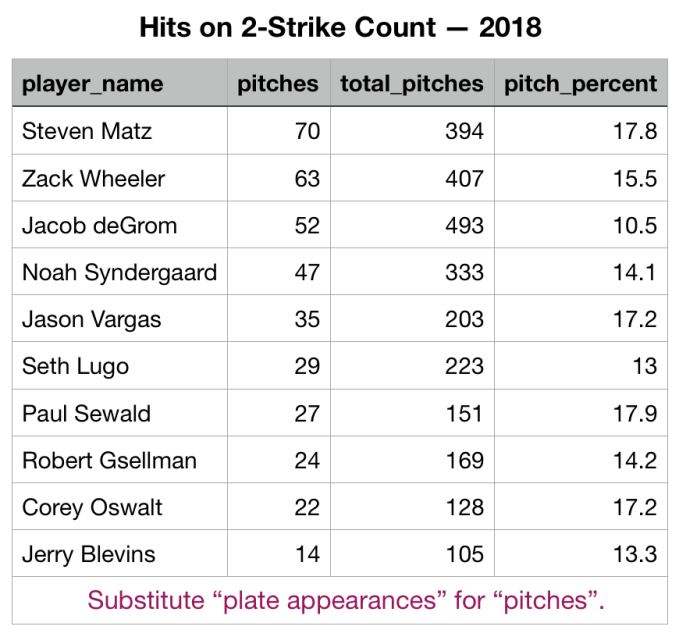
Change Total Pitch Parameters: Click “Plate Appearances.”
Being a Mets fan, the third name in the results drew my attention: Pete Alonso. Up to May 13 he has 20 barrels in 165 plate appearances (12.1%). The radial chart below shows the exit velocity and launch angle of each barrel. The area in red contains the barrels. To see the “live” chart, click this link.
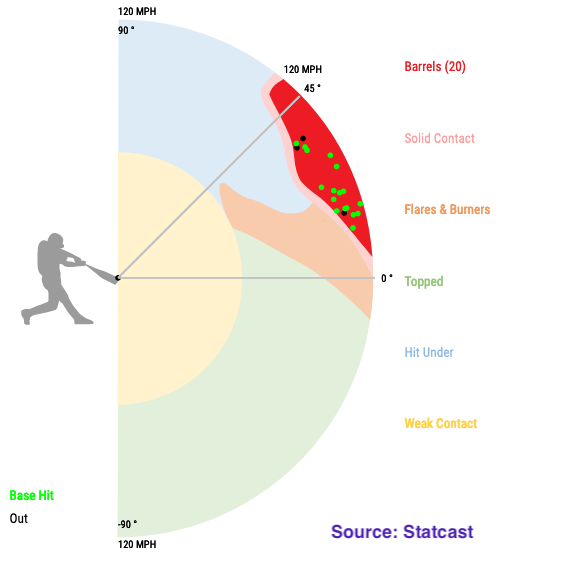
Position your cursor over the topmost circle in the Barrels area. When you do that, the information in the image below should appear.
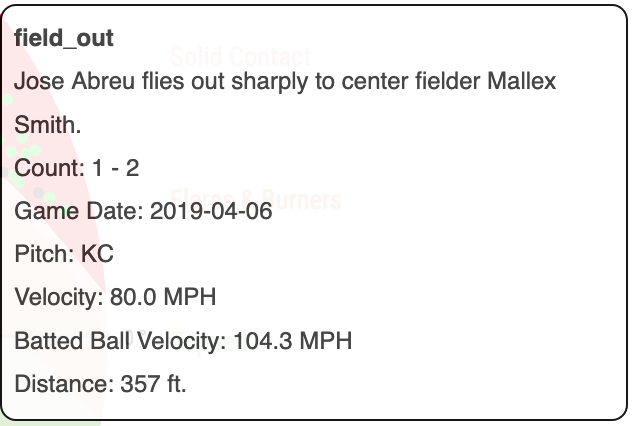
The three black circles indicate outs, the 17 green circles hits, so not every barreled ball is a hit. “KC” is knuckle curve.
Some other facts:
- The average distance of Alonso’s barreled balls is 386.5 feet.
- The average launch angle is 23.69º.
- The average exit velocity is 109.8 mph.
- The hardest-hit ball traveled at 118.3 mph.
- The lowest launch angle was 12º: the result, a line drive double to left field.