The New Knuckleball

This season, not one knuckleball has been thrown.

In 2018, only one pitcher threw it — Steven Wright. His nickname is “Knucksie.” He threw 824 pitches. Of them, 719 or 87.3% were knuckleballs. This season, he has yet to play because of an 80-game suspension.

In 2017, three pitchers threw them: R. A. Dickey, Steven Wright, and Erick Aybar, with Dickey throwing the most — 2,333.

In an article on NPR’s website, physicist Alan Nathan describes how a knuckleball is thrown.

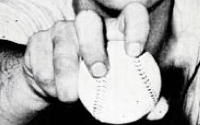
The ball has to be gripped with two (carefully manicured) fingernails and sort of pushed toward the plate. The object is to put just a little spin on it and let it be nudged around as air flows over the ball’s stitches and any little scrapes or abrasions on the leather.

The article also contains an image of “the knuckleball grip used by Boston Red Sox pitcher Steven Wright.”

Hoyt Wilhelm 1959 (Wikimedia)

Though the knuckleball has brought renown to Hall of Famer Hoyt Wilhelm and others, it’s almost extinct today in the major leagues, replaced by the knuckle curve, an offshoot of the knuckleball. Wilhelm threw his first pitch in Major League Baseball on April 18, 1952 when he was 28 years old, his career lasting until July 21, 1972.

Dan Rozenson, in a Baseball Prospectus article, describes how a knuckle curve is gripped and includes this image.

In a Sports Illustrated article, Gerrit Cole’s knuckle curveball is described as “filthy.” Watch it in action:

This season, as of May 15, 51 pitchers have thrown at least one knuckle curve though eight have thrown just one. Among the pitchers who throw it are Zach Godley, Aaron Nola, and Drew Pomeranz. In 2019, all three have already thrown more than 200 with Godley throwing the most: 48.2% of all the pitches that he has thrown have been knuckle curves, which is the most in MLB: Statcast Search | baseballsavant.com. Of his 341 knuckle curves — out of 708 pitches, batters got 18 hits (5.3%), the lowest percent of the top three, Statcast Search | baseballsavant.com. With his other 367 pitches, batters got 26 hits (7.1%), so he has been somewhat more effective when throwing the knuckle curve.

Last season’s knuckle curve leader, Lance McCullers Jr. (982, 46.6%), has yet to play in 2019 because of Tommy John surgery.

Though to some it seems like a hard pitch to hit, in 2019 batters are hitting .234 (191 for 817) off knuckle curves — Statcast Search | baseballsavant.com — but only .213 (2474 for 11603) against the other breaking pitches (slider, curveball, knuckleball, Eephus) and .217 (1221 for 5616) against off-speed pitches. On the plus side, the league average against fastballs is .266 (6266 for 23533).

Godley’s focus on the knuckle curve has not seemed to benefit him. His 2019 ERA is 7.65 (highest in his career) in 37.2 innings though his fielders must assume some responsibility as his FIP is 5.66, almost two points fewer, and his Contact Percentage is 75.3%, the highest in his career, according to FanGraphs.

Three teams have thrown only one knuckle curve this season: Pirates, Rays, and Braves. Together, they have thrown 18,302 pitches. The Diamondbacks have thrown the most knuckle curves: 526.

Statcast School: Barrels

Pete Alonso has quickly become one of the top power hitters in Major League Baseball, but unlike in days of old, how many homers a batter hits and how far he hits them are no longer the only measures of a slugger. Today, “barrels” has become a popular indicator.

In an article for Baseball Prospectus, Russell A. Carleton wrote that

Until Statcast, we didn’t have systematic (public) data on how hard a batter hit the ball. Now, we know how fast the ball was going when it left the bat and at what angle the ball was “launched.”

MLB defines a barrel as those

batted-ball events whose comparable hit types (in terms of exit velocity and launch angle) have led to a minimum .500 batting average and 1.500 slugging percentage since Statcast was implemented Major League wide in 2015.

Further, “To be Barreled, a batted ball requires an exit velocity of at least 98 mph,” according to MLB.

Here is MLB’s definition of a batted-ball event:

A Batted Ball Event represents any batted ball that produces a result. This includes outs, hits and errors. Any fair ball is a Batted Ball Event. So, too, are foul balls that result in an out or an error.

To start, in Statcast I sought to answer this question: Which players have hit the most barrels this season. To do the search, I used the search settings below.

Player Type: Batter
Season: 2019
Season Type: Regular Season
Quality of Contact: Barrel
Min # of Total Pitches: 25 Pitches
Sort By: Pitches
Change Total Pitch Parameters: Click “Plate Appearances.”

Being a Mets fan, the third name in the results drew my attention: Pete Alonso. Up to May 13 he has 20 barrels in 165 plate appearances (12.1%). The radial chart below shows the exit velocity and launch angle of each barrel. The area in red contains the barrels. To see the “live” chart, click this link.

Position your cursor over the topmost circle in the Barrels area. When you do that, the information in the image below should appear.

The three black circles indicate outs, the 17 green circles hits, so not every barreled ball is a hit. “KC” is knuckle curve.

Some other facts:

  • The average distance of Alonso’s barreled balls is 386.5 feet.
  • The average launch angle is 23.69º.
  • The average exit velocity is 109.8 mph.
  • The hardest-hit ball traveled at 118.3 mph.
  • The lowest launch angle was 12º: the result, a line drive double to left field.

Finding Met with most base hits in 2019 with runners on base

Which Mets player had the most base hits in 2019 with runners on base?

That is the research question which the table at the top of this page answers.

How to get the information in the table
(I did the search before the Mets game on May 2, 2019. As you will be doing it on a later date, your results will be different.)

Go to Statcast Search and match the settings below.

For PA (Plate Appearance) Result you have 26 choices. Group select “Base Hit” to choose all four types of hits: single, double, triple, and home run. This will appear in the PA Result box as “Homerun (4).”

For Season Type you have three choices: Regular Season, Playoffs, and Spring Training. Choose “Regular Season.”

Season: 2019

Player Type: From the 10 choices, select “Batter.”

Team: Select “Mets.”

Runners On: You have nine choices. Select “Runner On Base.”

Min # of Total Pitches: Choose 50. That will require a player to have at least 50 plate appearances (not pitches) because of the next setting. Though the row heading say “Total Pitches,” I will be overriding that so it contains plate appearances.

Change Total Pitch Parameters: “Check Plate Appearances.”

Note: On its bottom, The Change Total Pitch Parameters box contains these statements: (a) “Use these check boxes to select which columns to include in the ‘Total Pitches’ column in the results” and (b) “The default is every pitch.” By checking “Plate Appearances” that information will appear under the heading “Total Pitches” in the resulting table.

In addition, check “Runner On.” Then, the search result will show all the 2019 plate appearances of the Mets hitters in which there was at least one runner on base and, in them, how many base hits there were.

Change Total Pitch Parameters box, Source: Baseball Savant

It would be preferable if “Plate Appearances” appeared instead of “Total Pitches,” but that is not what happens. To further confuse things, there is a Results column in the Results table. The Results column in this scenario contains the number of base hits. Finally, the “% of Pitches” column does not contain a pitch count. Instead, it contains the percent of plate appearances in which the player got a base hit.

Analysis of Results
Amed Rosario has the most base hits so far in 2019 with runners on base. He came to the plate 58 times with runners on base and got a base hit in 19 of them (32.8%).

In the results table below, for clarity the column headings have been adjusted.

This link will take you the Statcast Search page that shows the Search form.

In contrast, Rosario had 58 plate appearances with no one on base and got 11 hits in them (19.0% of those plate appearances) — That data is from a different Statcast search.

Rosario had a much higher hit rate with runners on base than with none on (32.8% vs. 19.0%). Did the added pressure of “runners on” cause him to concentrate more? Did he change his hitting approach?

The next statistics are from baseball-reference.com. They were obtained on May 2, 2019 for Amed Rosario to provide independent verification of his Statcast results:

The first row in the table from Baseball Reference contains data that we have not obtained. To get Rosario’s RISP results in Statcast, two changes must be made. One is the “Runners On” row’s contents must be switched to “RISP,” but if that were the only change made, when I ran the search I would get this message: “There are no results for your search.” That’s because no Mets batter has 50 plate appearances with a runner in scoring position — it’s too early in the season. By reducing “Min # of Total Pitches” to 25 I averted the problem.

For those interested, Rosario got those 11 hits in 32.4% of his plate appearances with a runner in scoring position (34). That was the highest percentage on the team. Ramos was second, and though he also had 11 hits with RISP, he got them in 38 plate appearances (28.9%). Surprisingly, Alonso was fourth with only six hits in 26 PA (23.1%). Third best was McNeil with 10 hits in 35 PA (28.6%). Rounding out the top six was J.D. Davis with 5 hits in 29 PA (17.2%) and Conforto with 5 hits in 39 PA (12.8%).

Ramos needs to narrow extra-base hits gap between him and Alonso

After 24 games, Pete Alonso leads the Mets with 16 extra-base hits.

He’s also sixth in Major League Baseball with 58 total bases. Further, his .682 slugging percentage is the highest on the team and the 13th-best in Major League Baseball.

At the opposite extreme is Wilson Ramos with an 24 total bases and an SLG of .333, the 25th-lowest one out of 186 players. So far this season, he has only two extra-base hits, a double and a homer.

A Mets pitcher, Zach Wheeler, has as many extra-base hits.

Continue reading “Ramos needs to narrow extra-base hits gap between him and Alonso”