Jacob deGrom is reviving memories of Tom Seaver

One of the best ways to judge a starter is by how many earned runs he gives up in his starts over his career.

Only one Mets pitcher has started more than 300 games in which he gave up three or fewer earned runs: Tom Seaver. In them, he had an amazingly low ERA of 1.68. The only current Met in the Top 10 is Jacob deGrom.

Mets with number of starts in which 3 or less earned runs were given up
The data source for this post is stathead.com.

In 245 of his starts, Tom Seaver gave up two or fewer earned runs. But he did not have the highest W-L% among the Top 7. Al Leiter won almost 90% of the games in which no more than 2 runners crossed the plate w/o the aid of an error or passed ball.

Among Mets pitchers with at least 80 starts, only one had a W-L% greater than 90%. That was Bobby Jones, who pitched for the team from 1993-2000. In 85 starts he won almost 10 times as many as he lost (53-5).

When the number of earned runs surrendered in a start reduces to no more than one, deGrom moves up to fifth place and his W-L% jumps to 94.7%. Further, half the pitchers in that Top 10 list are left-handed.

Since deGrom’s career began in 2014, only five MLB starters have pitched more than 80 games in which they surrendered no more than one earned run.

Jon Lester and Jacob deGrom tied for first; however, Lester had both four more wins and four more losses.

Two other Mets are in the Top 40, Marcus Stroman and Michael Wacha. Rick Porcello ranks 52nd, Noah Syndergaard 57th, and Steven Matz 91st. Ex-Met Zack Wheeler ranks 71st.

Statcast Searches: Four Core Components

This post shows how to use Statcast Search to do these investigations:

1. Find pitching data for all the pitchers in a league (National or American or both) in a year (limited by Statcast Search’s years of data)

2. Get the number of pitches each league pitcher threw to another pitcher in the same league.

3. Find how many pitches a specific pitcher threw to other pitchers.

4. Discover how many pitches a pitcher threw to every batter regardless of position.

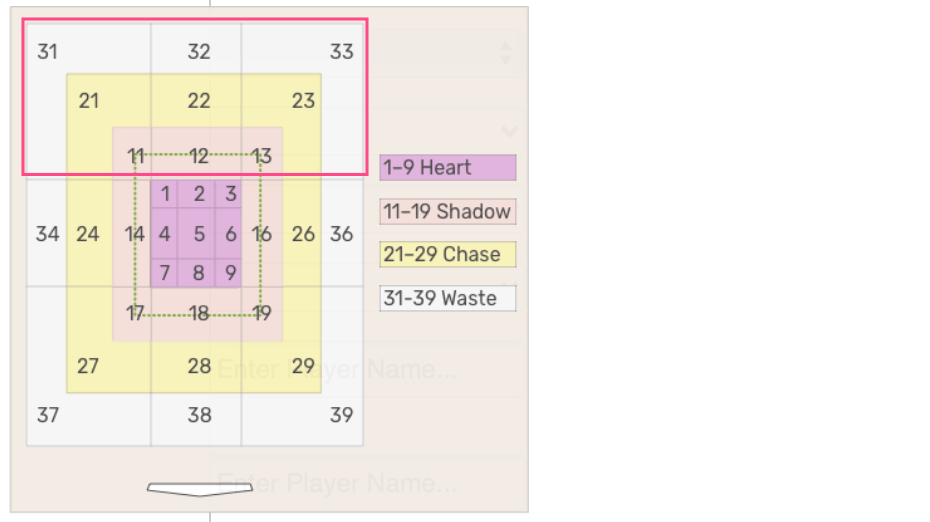
When conducting a Statcast Search, four components are especially useful. One is Player Type. It contains 10 items: Pitcher, Batter, Catcher, 1st, 2nd, 3rd, SS, LF, CF, RF. The default value in Player Type is “Pitcher.”

The other three core items are Position, Batters, and Pitchers.

If you want to find pitching data for all the pitchers in the National League in 2019, use these four settings:

– Player Type: Pitcher
– Team: NL
– Season: 2019
– Season Type: Regular Season

If you search using those values, you will get data for 426 NL pitchers, starting with Stephen Strasburg, who threw the most pitches: 3,384.

The search results https://tinyurl.com/yawcthuu include these columns sorted by Pitches from a pitcher’s perspective: Pitches, Total, Pitch %, AB, Hits, BB, BA, SLG, EV(MPH),LA(°), Dist (ft). Pitches is the number of pitches thrown by the pitcher during all his mound appearances.

If instead of finding pitching data for all the pitchers in the National League in 2019, you want the number of pitches each NL pitcher threw to another pitcher you need to change the Position setting (second column) from the default of any position to “P” (Pitcher). https://tinyurl.com/ybwcxo3e

That reduces the number of results from 3,384 to 300. Those results show the number of pitches each NL pitcher threw to another pitcher. What is not immediately obvious is whether all the other pitchers were also in the National League though that appears to be the case. It is true.

Jacob deGrom heads the list. In 2019, with only pitchers in the batters box, he threw 220 pitches, holding those hitters to a .120 batting average.

Let’s make another setting change. This time in the Pitchers box (third column), Stephen Strasburg will be selected. (Position still is “P.”) Those results show how many pitches Strasburg threw to other pitchers: 208. By clicking his name, a pitch breakdown appears. https://tinyurl.com/ybxooty7

If Position is not set to a position, the results show how many pitches Strasburg threw to every batter regardless of position (3,384) and gives a pitch-by-pitch breakdown. https://tinyurl.com/y8aefb8u

But what if in the Batters box (third column), Stephen Strasburg was entered with nothing selected in Position? Then, the results show his hitting data for the 38 NL pitchers that he hit against. He was in the batters box against Sandy Alcantara for 22 pitches, the most, including one eight pitch at-bat that ended in a groundout. Strasburg has the most success at the plate against Braves pitcher, Touki Toussaint, getting a single and a homer in his two at-bat against Toussaint. Toussaint also was the only pitcher Strasburg got more than one hit against. The homer was both his only homer in 2019 and only the fourth in his 10-year career. Note: Setting the Position to “P” does not make any difference. https://tinyurl.com/ybnxnefa

And if there is a “P” in Position? The results are the same. https://tinyurl.com/yb8ao6v6

Statcast Detective: Throw ’em high

In my first post on high-ball pitchers, I presented the top 10 high-ballers in 2019. On the bottom of the list based on the number of high-balls thrown was Astros starter Jordan Lyles, but his high-ball pitch percent of 28.4% pushed him into the two-spot. Given that the League average in 2019 was 16.8%, Lyles was more than 50% above average.

The strike zone has changed over the years. According to the OFFICIAL BASEBALL RULES, 2019 Edition,

The STRIKE ZONE is that area over home plate the upper limit of which is a horizontal line at the midpoint between the top of the shoul- ders and the top of the uniform pants, and the lower level is a line at the hollow beneath the kneecap. The Strike Zone shall be determined from the batter’s stance as the batter is prepared to swing at a pitched ball.

To appreciate what a high pitch is you need to know the strike zone’s dimensions.

Mike Fast wrote that there are two ways to dimension the strike zone.

One is to use fixed heights for the top and bottom boundaries of the zone for all batters, regardless of the height or stance of the batter.  The most commonly used fixed heights are 1.5 feet for the bottom of the zone and 3.5 feet for the top of the zone.

As the second way involves the statistical technique of normalization, it will not be covered in this post. Those mathematically inclined can find an explanation here.

As Fast’s article was published in 2011, I checked the strike zone a second way. Statcast’s “Plate Z” setting shows a pitch’s height. In 2019, the average height of a pitch in the high-ball zone was 3.65 feet. In all zones, the average height was 2.25 feet. Since 2015, the average heights have been 2.25, 2.26, 2.41, 2.25, and 2.25, so they have been almost identical in four of the past five years.

This is a HIGH pitch.

And some batters can clobber pitches even when they are high.

Lindor’s homer, his 18th, was hit off a pitch 3.53 feet high and was the only homer he hit that season off a pitch at least three above the plate. In 2018, the average pitch height of his homers was 2.16 feet.

To be continued

Statcast Detective: Top High-Ball Pitchers

In 2018, Dave Sheinin wrote about a hitting change in Major League baseball. More hitters, he said, were becoming “becoming launch-angle disciples.”

More batters are focusing not only on hitting the ball hard, but hitting the ball high into the air. The average launch angle — the angle at which the ball flies after being hit — rose from 10.5 degrees in 2015 to 11.5 degrees in 2016.

Dave Sheinin — https://www.washingtonpost.com/graphics/sports/mlb-launch-angles-story/

To counter that change, pitchers responded by throwing “fewer sinkers, fewer low pitches, more breaking balls, more four-seam fastballs, more high pitches.”

Their pitches were elevating.

Using Statcast Search, I first investigated how many pitches in 2019 were in the upper portion of the Attack Zones. The graphic below from baseballsavant.com shows the nine zones in the “high-ball” area, zones 11-13, 21-23, and 31-33. All are above the heart zone, which is lavender-colored. The heart zone pictures the heart of the plate.

The first question to be researched is From 2017 to 2019, how many pitches were thrown in the “high-ball” area?

To answer it, these Statcast Settings were used:

  • Player Type: Pitcher
  • Group By: League and Year
  • Attack Zones: 11, 12, 13, 21, 22, 23, 31, 32, 33
  • Season: 2017, 2018, 2019
  • Season Type: Regular
YearPitchesTotalPitch %
1League201912300373247316.8
2League201811594472119016.1
3League201711111272124315.4
https://tinyurl.com/yb4mbtvk

Since 2017, the percentage of high-ball pitches increased from 15.4% to 16.8% as the number increased by 11,891. An unexpected result is that the total number of pitches also increased from 2017 to 2019 by 11,230, but that is a topic for another post.

Throwing balls high has its risks.

Sheinen’s article includes this Bud Black quote:

“It’s still dangerous throwing the ball up in the zone. That hasn’t changed,” said Colorado Rockies Manager Bud Black, a former pitcher. “You have to throw it at the right height. If you throw it too high they’ll take it [for a ball], but if you miss it low, they’ll crush it. It isn’t for everybody. There are pitchers whose style and stuff allows them to pitch up there, guys we identify as highball pitchers, and we encourage them.”

That led to the second question: In 2019 which pitchers took that risk the most and what were the results?

Revised Statcast Search Settings

  • Player Type: Pitcher
  • Group By: Player Name
  • Attack Zones: 11, 12, 13, 21, 22, 23, 31, 32, 33
  • Season: 2019
  • Season Type: Regular

Here are the top 10 pitchers in 2019 ordered by number of high-ball pitches they threw.

PlayerPitchesTotalPitch %
Trevor Bauer875368723.7
Gerrit Cole869336225.8
Jake Odorizzi826278729.6
Rick Porcello793296026.8
Steven Matz745270227.6
Justin Verlander745344821.6
Caleb Smith743266127.9
Reynaldo Lopez708316322.4
Jacob deGrom699329721.2
Jordan Lyles698245628.4
Source: baseballsavent.com

Minnesota Twins starter Jake Odorizzi led the Top 10 in high-ball percent, nudging 30%. Last season, he also had his personal bests in won-lost percentage (.682), strikeouts per nine innings (10.1), and wins (15). Surprisingly, his 2019 Pitch % of 29.6% was not his career high. In 2017 with the Rays it was 30.3%; however, his won-lost record was 10-8, so just keeping pitching high may not have been the main cause of his increased success in 2019. But that too is a topic for another post’s investigation.

Given that in 2019 Odorizzi’s improved by 114% the number of games he won in the previous season, did the other members of the Top 10 experience a similar gain?

Eight of the Top 10 won more games in 2019 than in 2018, Trevor Bauer failing to match his 2018 win total by one game though he started six more games, a league switch likely the cause. He had a winning record with the Indians, but then a losing one with the Reds. In addition, Rick Porcello had three fewer wins in 2019 though starting only one fewer games.

Player20182019
Trevor Bauer12-611-13
Gerrit Cole15-520-5
Jake Odorizzi7-1015-7
Rick Porcello17-714-12
Steven Matz5-1111-10
Justin Verlander16-921-6
Caleb Smith5-610-11
Reynaldo Lopez7-1010-15
Jacob deGrom10-911-8
Jordan Lyles3-412-8
Won-Lost records for Top 10 high-ball pitchers in 2019

To be continued