Noah Syndergaard threw the most called strikes — 3095.
Among the starters, was that the highest percentage of called strikes?
To answer that, change the Position setting to “SP.” In the Search Results, the Pitch % column contains the answer. If the column is not in descending order, click the column title until it is.
The starter with the highest percentage of pitches that were called strikes was Steven Matz. Of the 2,702 pitches he threw, 479 were called strikes. That is 17.7%.
Noah Syndergaard had the third highest called-strike percentage.
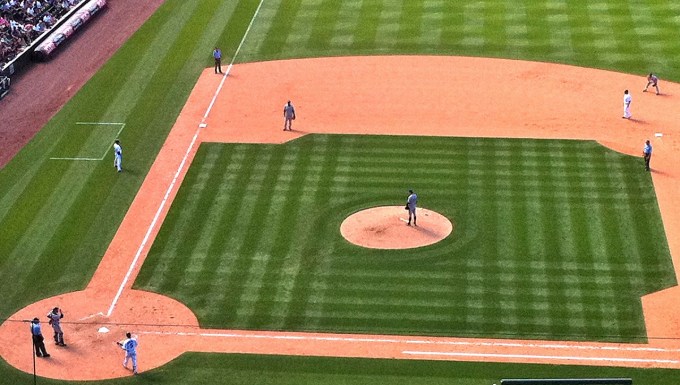
When a third baseman is playing close to the bag, he is not much more than 90 feet away from the batter. Only the pitcher, and sometimes the first baseman, is closer. A ball hit to third base can exceed 100 miles per hour. At 100 mph, that is 146.7 feet/second, so it will reach the third baseman in fewer than one second. Not much time to react.
Who has hit the hardest ball (ground ball or line drive) to third base this season? Here is how to find that out.
Statcast Search Selections 1. Batted Ball Type: both Line Drive and Ground Ball 2. Batted Ball Location: Third Base 3. Season Type: Regular Season 4. Season: 2019 5. Player Type: Batter 6. Metric Range: Exit Velocity 7. >=: 114 8. Min # of Total Pitches: None 9. Min # of Results: None 10. Group By: Player Name 11. Sort By: Pitches 12. Sort Order: Desc 13. Min PA: None 14. Change Total Pitch Parameters: None
Results
Two batters qualified: Maikel Franco and C. J. Cron. On April 25, 2019 Franco hit a 114.1 mph per hour line drive at Marlins third baseman Martin Prado. The ball traveled 138 feet. On June 23, 2019, Cron hit a 114.7 mph grounder at Royals third baseman Hunter Dozier. Its distance: 122 feet. Thus so far this season (as of games thru June 23), C. J. Cron has hit the hardest ball to third base.
Two Research Questions (Use Statcast to find answers) As of games through June 23, 2019, how many batters hit a ball at least 114 mph? Who hit the one with the greatest exit velocity? How fast was it?
If one of the secrets to pitching success is to get off to a good start with each batter faced then the Mets’ pitchers seem to have forgotten it.
While this season the League’s first-pitch batting average against pitchers is .348 (2420 for 6952), opposing batters are hitting .391 (99 for 253) against the Mets’ first pitches.
That is the third-highest in MLB, 43 points higher than the league average. Joining the Mets in the top six are the Pirates, Orioles, Marlins, and Reds. All have losing records.
Tops among the Mets starters is Jacob deGrom. Against him, opponents’ first-pitch batting average is .424 (14 for 33).
In 2018, opponents batted .378 against him on first pitches, still quite high, but 46 points fewer than this season.
As the Mets’ playoff probability declines — it is now 17.5% — they might want to investigate why opposing batters are hitting a Ted Williams-like average against their starters.
Pete Alonso has quickly become one of the top power hitters in Major League Baseball, but unlike in days of old, how many homers a batter hits and how far he hits them are no longer the only measures of a slugger. Today, “barrels” has become a popular indicator.
In an article for Baseball Prospectus, Russell A. Carleton wrote that
Until Statcast, we didn’t have systematic (public) data on how hard a batter hit the ball. Now, we know how fast the ball was going when it left the bat and at what angle the ball was “launched.”
MLB defines a barrel as those
batted-ball events whose comparable hit types (in terms of exit velocity and launch angle) have led to a minimum .500 batting average and 1.500 slugging percentage since Statcast was implemented Major League wide in 2015.
Further, “To be Barreled, a batted ball requires an exit velocity of at least 98 mph,” according to MLB.
Here is MLB’s definition of a batted-ball event:
A Batted Ball Event represents any batted ball that produces a result. This includes outs, hits and errors. Any fair ball is a Batted Ball Event. So, too, are foul balls that result in an out or an error.
To start, in Statcast I sought to answer this question: Which players have hit the most barrels this season. To do the search, I used the search settings below.
Player Type: Batter Season: 2019 Season Type: Regular Season Quality of Contact: Barrel Min # of Total Pitches: 25 Pitches Sort By: Pitches Change Total Pitch Parameters: Click “Plate Appearances.”
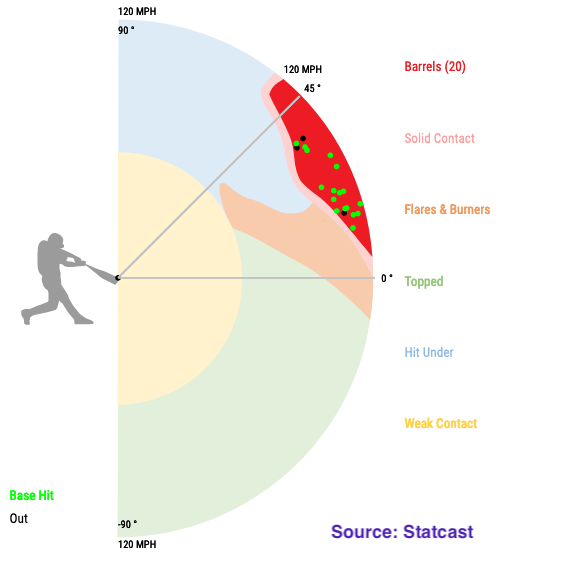
Being a Mets fan, the third name in the results drew my attention: Pete Alonso. Up to May 13 he has 20 barrels in 165 plate appearances (12.1%). The radial chart below shows the exit velocity and launch angle of each barrel. The area in red contains the barrels. To see the “live” chart, click this link.
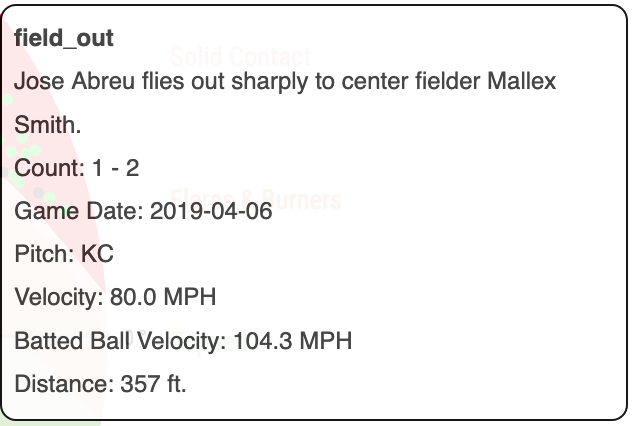
Position your cursor over the topmost circle in the Barrels area. When you do that, the information in the image below should appear.
The three black circles indicate outs, the 17 green circles hits, so not every barreled ball is a hit. “KC” is knuckle curve.
Some other facts:
The average distance of Alonso’s barreled balls is 386.5 feet.
The average launch angle is 23.69º.
The average exit velocity is 109.8 mph.
The hardest-hit ball traveled at 118.3 mph.
The lowest launch angle was 12º: the result, a line drive double to left field.