Not a good way to start a new month.🤞
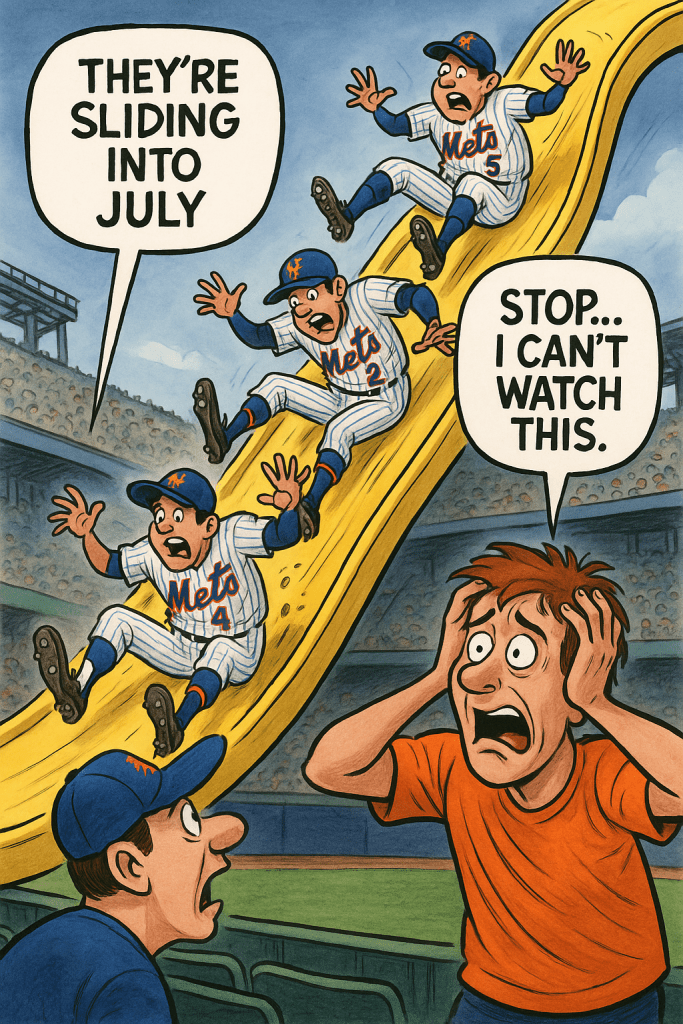
Not a good way to start a new month.🤞
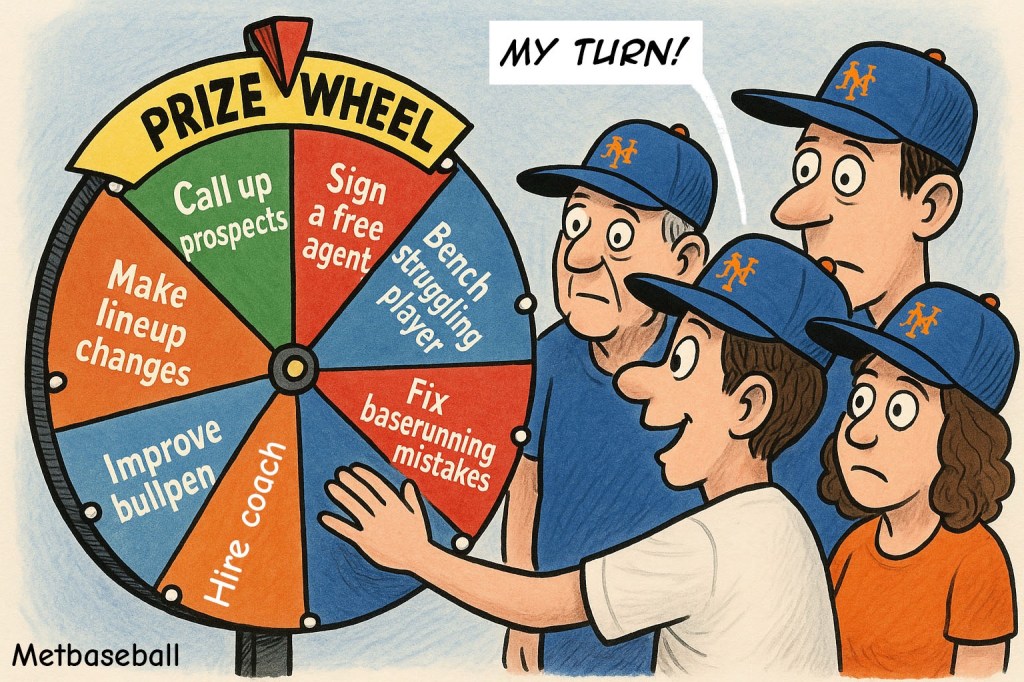
Where do you want the ↘️spinner↗️ to land to get the Mets back on the winning track?
Have another choice? What would you add to the wheel?
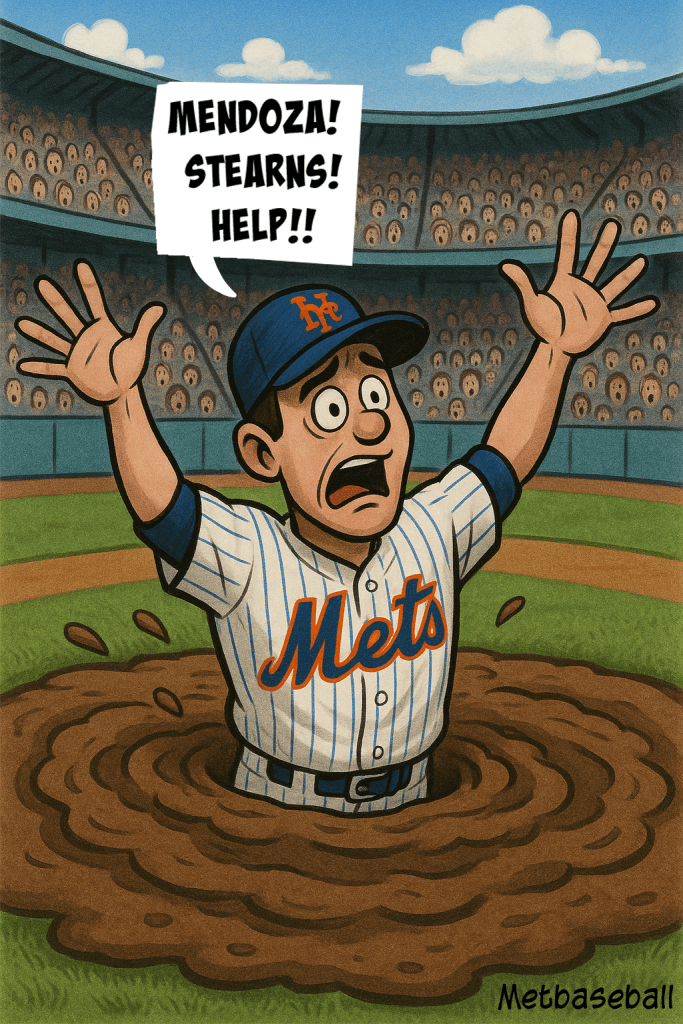
Maybe the Mets shouldn’t hold a team meeting before a series’ final game.

After eight straight losses, the Mets seem lost in a maze they made. To make matters worse, in their last three games they have been outscored 22 to 3.
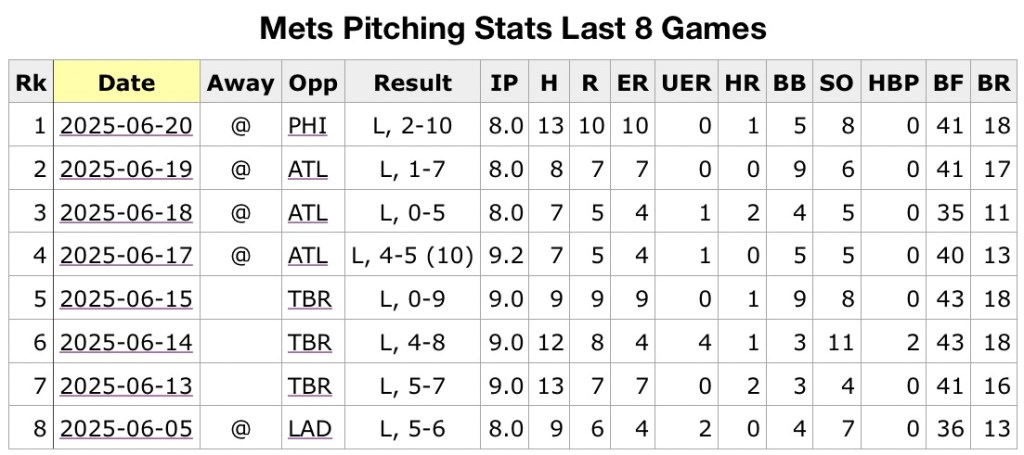
Since 1962, in a three-game span, the Mets have scored three or fewer runs while allowing their opponents to score 22+ runs 29 times, per Stathead. Further, they have lost by at least 22 runs in those games 12 times.
Data source: https://stathead.com/tiny/0Nend
