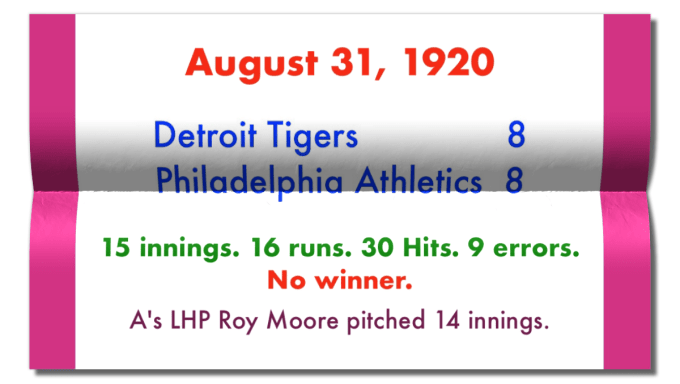

In 1920 the Detroit Tigers played 155 games, finishing the season with a 61-93-1 record. The “one” occurred on August 3 in their 122nd game against the Philadelphia Athletics at Shibe Park.
Fifteen innings after the game began, though 16 runners had crossed the plate, it ended without a winner.
It was never finished.
Each team used only two pitchers. For the Tigers, RHP Doc Ayers started the game and, after 6.2 innings, was replaced by LHP Red Oldham, who gave up only one earned run. The A’s started with RHP Slim Harriss. He lasted one inning: Five runs crossed the plate, but only one was earned. His successor, LHP Roy Moore, gave up 13 hits, but only three runners scored.
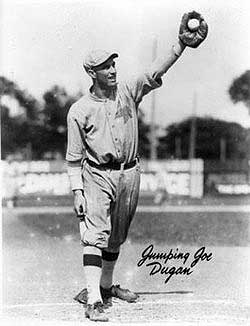
Combined, the teams got 30 hits. Center fielder Ty Cobb led the Tigers offense, getting four hits. A’s third baseman “Jumping Joe” Dugan did even better. He got five hits.
Only five of the game’s hits were for extra bases, all doubles.
That season, the Tigers hit just 30 homers. Outfielder Bobby Veach, who led the team in homers with 11, hit more triples (15) than homers. The Tigers hit 72 triples, but that was only fifth-best in the American League, the White Sox hitting the most three-baggers, 98, one shy of the Brooklyn Robins’ MLB-leading 99 triples, the league as a whole hitting 621 versus only 369 homers.
Only two teams hit more home runs than triples, the Philadelphia Athletics and New York Yankees, Babe Ruth blasting 54 in his first 50-plus season.
The Babe, not known as a triples hitter, hit nine in 1920 and 136 in his career.

Eddie Ainsmith caught the whole game for the Tigers; whereas, for the A’s, Cy Perkins started the game, staying in it long enough to get seven plate appearances, the same number as his replacement, Glenn Myatt, the game’s starting right fielder. Though the boxscore does not reveal when Myatt switched positions, his replacement in right field, Dick Burrus, did not have a plate appearance, so it had to be late in the game.
The teams made nine errors. The A’s made six of them. Dugan’s error was his 29th of the season. Despite that, a BR Bullpen article says that he was “[a] brilliant fielding third baseman.”
Two men umpired it. George Hildebrand was behind the plate and George Moriarty at first base. Four umpires in a regular-season game did not begin until 1952.
The game lasted three hours and four minutes, but then, in those days baseball’s clock ran faster.
Other tie games in MLB history