Mets Best Starters by Decade

To win a baseball game, a team needs to outscore its opponents. To do that, it needs to prevent the other team from scoring as many runs as it does. The leader of the prevention part is the pitcher.

No batter leads the offense the same way that a pitcher leads the defense. He — and the catcher — are involved in the most plays in a game, but the pitcher plays a bigger role because what he does initiates the majority of a game’s plays.

A measure of a pitcher’s success in limiting other teams’ run scoring is the RE24 stat. An RE24 of zero means the player is average. On some websites, the higher a pitcher’s RE24, AKA run value, the better the pitcher performed, so a value of +24 would be much better than -24.

Sites that express it that way are Baseball Reference, FanGraphs, and Stathead with Baseball Reference now calling the RE24 for pitchers “Base-Out Runs Saved“; whereas, on other sites, such as Baseball Savant, it is the opposite: the lower a pitcher’s run value, the better. A value of -24 would be much better than +24.

Further, the complexity of the RE24 calculation has increased substantially since its early days when it was based on just base/out states and outs. For example, today on Baseball Savant, there is a Pitch Arsenal Stats Leaderboard giving a pitcher’s run value based on pitch type (e.g., changeup) “and on the runners on base, out, [and] ball and strike count,” and a Swing & Take Leaderboard giving for a pitcher a run value based on a pitch’s “outcome (ball, strike, home run, etc).”

In the chart below, the Mets top two starters in each decade based upon their RE24 totals (base-out state) in that decade are shown. The decade leaders are Tom Seaver (twice), Dwight Gooden, Rick Reed, Al Leiter, and (so far in this decade) Jacob deGrom (twice). Those five would make a starting rotation that few Mets fans would complain about.

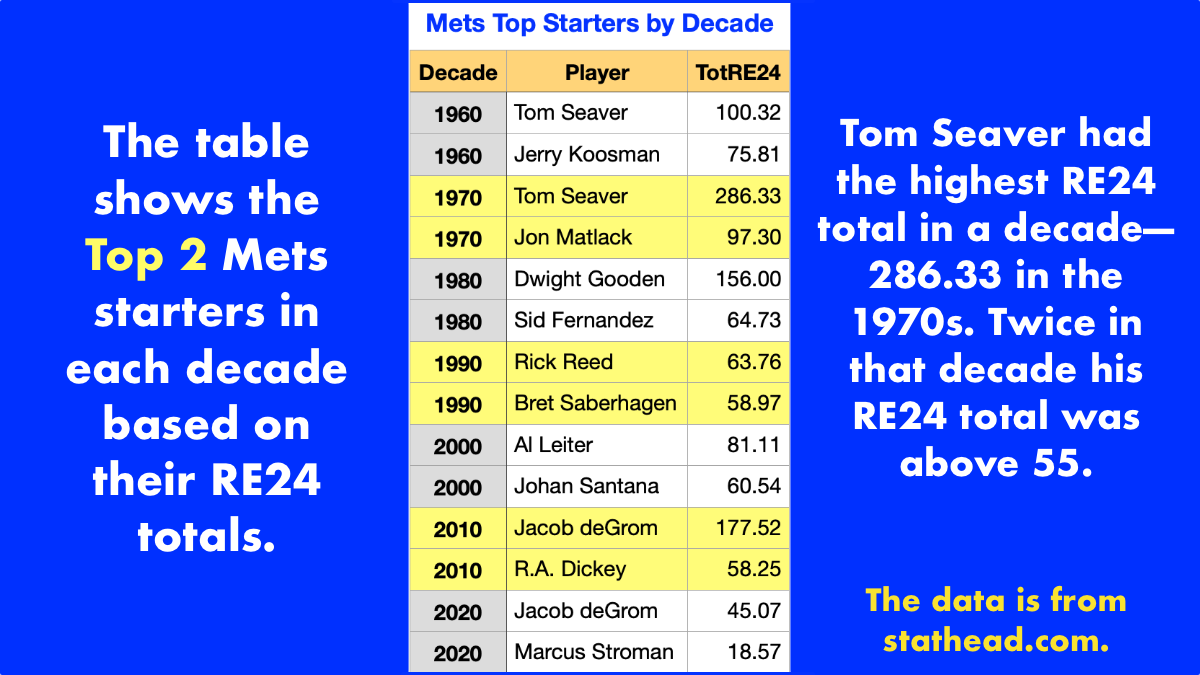
The second-place finishers include Jerry Koosman, Jon Matlack, Sid Fernandez, Bret Saberhagen, Johan Santana, R. A. Dickey, and Marcus Stroman. Further, Matlack had a higher RE24 than did the first-place finisher in two other full decades: the 1990s and 2000s. Even the second-place finishers would make a strong starting rotation.

One pitcher yet to throw a pitch for the Mets, but who is now a member of the team, Max Scherzer, has in his 14 years in Major League Baseball accumulated an RE24 of 318.5. In that timespan, only two other pitchers have accumulated a higher RE24: Justin Verlander is at 327.22, and Clayton Kershaw is at 431.64.

And in the decade from 2010 to 2019, Scherzer remains in third place with Jacob deGrom in eighth and Carlos Carrasco 33rd.

Stathead School: Get Home Game Info

For this search, you need to use Stathead Baseball’s Split Finders tool. It can be used to get both player and team data for both batting and pitching. When used for team batting, you can search one or multiple seasons. As I just wanted the data for a single season, I did a single season search.

Here is how to use Stathead Baseball to get the results in the above tweet.

  1. Go to Split Finders > Team Batting.
  2. Set Sort By to Descending and OBP.
  3. Make Seasons “2021 to 2021”.
  4. For Choose Split Type, select Home or Away.
  5. For Choose A Split, select Home.
  6. Under Team Filters, click or tap Choose a Team Filter.
  7. Then, click or tap Team.
  8. Click or tap Any Team
  9. Select New York Mets.
  10. Click or tap Get Results.

Under Current Search, you should see this:
▶︎ In the Regular Season, in 2021, For NYM, In the AL or NL or FL, Home (within Home or Away), sorted by greatest On-Base%.

To get the away game data, repeat the above steps, making this one change:
5. For Choose A Split, select Away.

View the Stathead results for home games and away games..

Mets trade for oldest MLB pitcher

The Mets just traded two players to the Tampa Bay Rays for Rich Hill who, at 41, is the oldest pitcher in Major League Baseball and the second-oldest player, the oldest Albert Pujols.

In 19 games this season, all starts, Hill has pitched best the first and third times in a game he has faced an opposing team’s batters. Then, they hit only .190 and .164 against him, but during his second time through a lineup they hit .276 with a .530 slugging percentage. See table below.

Source: https://www.baseball-reference.com/players/split.fcgi?id=hillri01&year=2021&t=p

The data in the table reveal that his best role could be either as an opener or a reliever. However, it is likely that the Mets will mainly use him as a starter.

Hill has done better against left-handed batters, holding them to a .158 batting average. In contrast, right-handed batters hit .232 against him, still low but 74 points higher.

Against his fastball, his most frequently thrown pitch, batters hit .257, 71 points higher than their BA (.186) against his breaking pitches — but they were not his most effective pitches. Those were his off-speed pitches with a .143 BA.

His average pitch velocity this season of 80.6 mph is his second-lowest since 2015. His hard-hit% is higher than in any previous Statcast season: 6.4%.

In 2021, he has thrown 785 fastballs, 623 breaking balls, and 41 off-speed pitches.

Hill has been much more effective when pitching without any runners on base. Then, batters are hitting just .203. With runners on base, opposing batters’ BA jumps 47 points to .250.

He last pitched on July 18 against the Braves. In 4 IP, he gave up six hits, three earned runs, and two walks, while striking out four.

A closer needs to shut the door, not open them

In a clutch situation, a closer need to shut the door, not allow the opponent to open and then run through them. The latter is what happened in yesterday’s Mets-Pirates game.

Photo by Filip Kominik on Unsplash

The victim: Edwin Diaz.

Let’s start by looking at his ERA as the season has progressed:
– April: 2.00
– May: 3.97
– June: 2.38
– July: 12.60

Over the past 30 days, his performance based on his ERA has been on the decline.
– Last 30 days: 8.38
– Last 15 days: 12.60
– Last 7 days: 27.00

In particular this season, Diaz’s performance in away games has been worse than in home games.
– Home ERA: 2.45
– Away ERA: 6.75

In home games, his record is 3-1; whereas, in away games it is 0-3. Similarly, in day games, his record is 3-1; whereas, in night games it is 0-3.

Even more surprising are his slash lines for right- and left-handed batters.
– Against right-handed batters: .275/.351/.362
– Against left-handed batters: .175/.303/.222

Diaz is at his best on two-strike counts.
– 0-2: .200 (BA)
– 1-2: .065
– 2-2: .200
– 3-2: .077

With regard to the effectiveness of his pitches, the run value when he throws his slider is -6; whereas, against his fastball it is +6. Run value reveals a pitch’s impact. The lower the value, the better.

Further, when he throws the slider, batters are hitting .180 with a .213 SLG, but when he throws his four-seamer, batters are hitting .268 with a .366 SLG. Those are the only two pitches Diaz has thrown this season with 63.1% of them four-seamers and 36.9% sliders.

Based on the above data, Diaz is at his best when he does not fall behind in the count, throws more sliders than four-seamers, faces left-handed batters, and pitches in home day games.

The data in this post is from espn.com and baseballsavant.com