
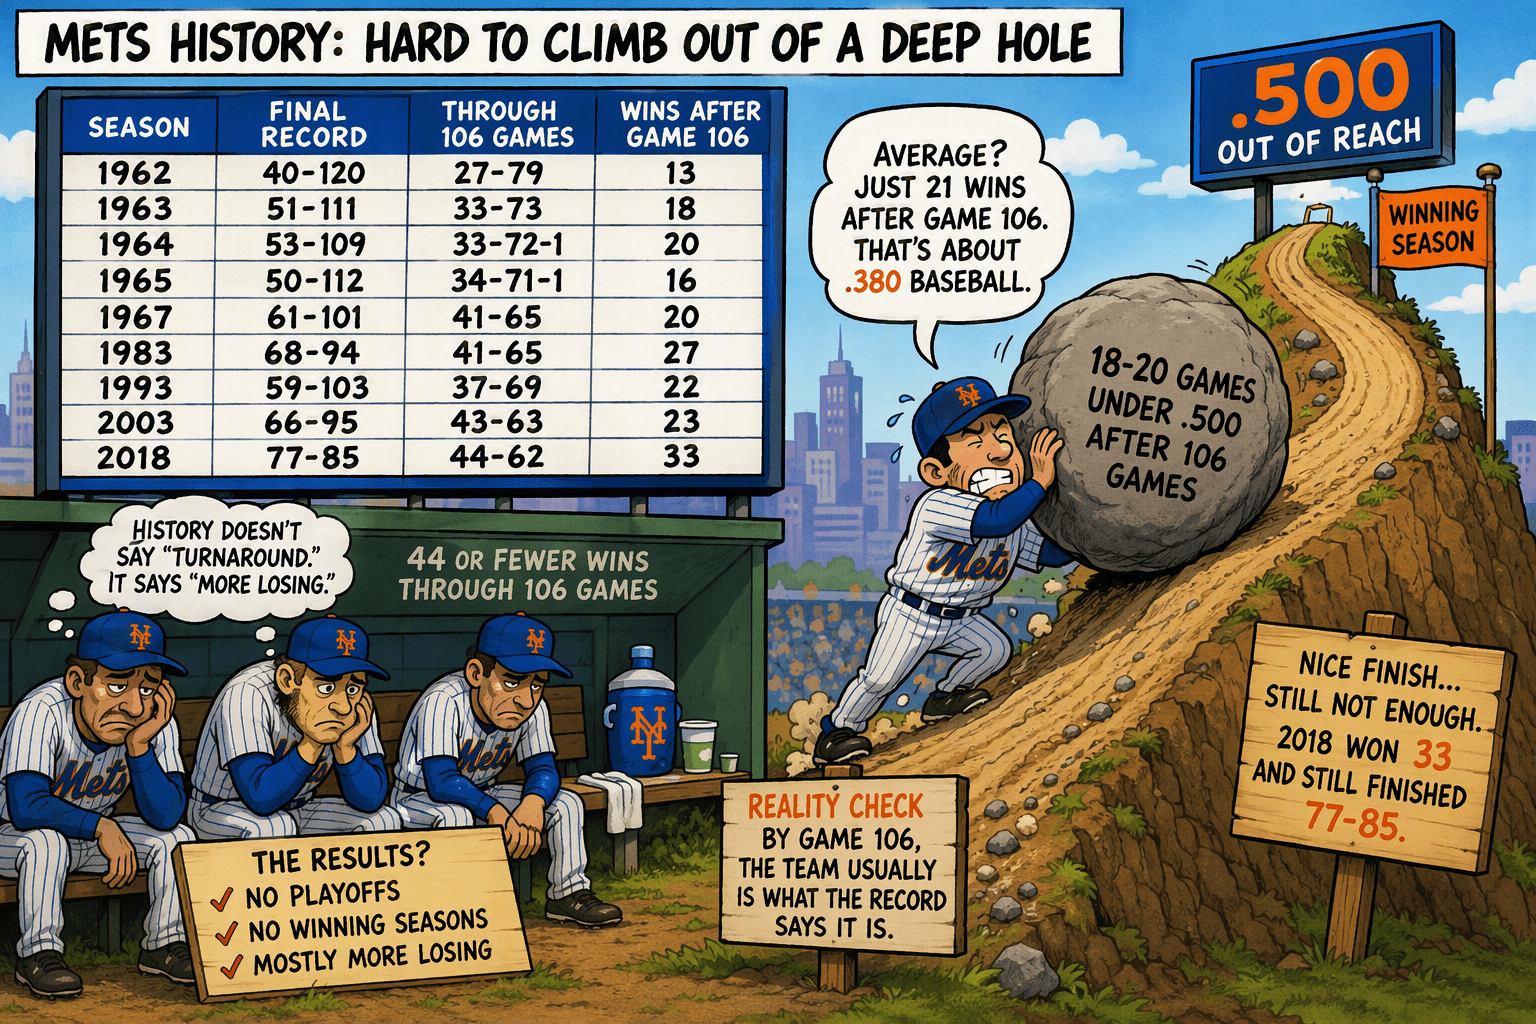
The infographic below provides evidence that, for the New York Mets, teams that are deeply below .500 after 106 games almost never recover enough to produce a successful season. The image combines historical data, visual storytelling, and a cautionary message about the difficulty of overcoming a poor start.
Baseball is full of stories about miraculous comebacks, late-season surges, and teams that catch fire when nobody expects it. But history suggests that there are limits to what even the hottest stretch can accomplish.
The infographic examines several New York Mets seasons in which the club had 44 or fewer wins through the 106 games. The message: by the time a team reaches that point, the season’s fate is often already determined.
The Historical Record
The table highlights nine Mets seasons that fit the criteria:
| Season | Record Through 106 Games | Final Record | Wins After Game 106 |
|---|---|---|---|
| 1962 | 27-79 | 40-120 | 13 |
| 1963 | 33-73 | 51-111 | 18 |
| 1964 | 33-72-1 | 53-109 | 20 |
| 1965 | 34-71-1 | 50-112 | 16 |
| 1967 | 41-65 | 61-101 | 20 |
| 1983 | 41-65 | 68-94 | 27 |
| 1993 | 37-69 | 59-103 | 22 |
| 2003 | 43-63 | 66-95 | 23 |
| 2018 | 44-62 | 77-85 | 33 |
The average performance after Game 106 was only about 21 victories. In modern baseball terms, that equates to roughly a .380 winning percentage over the remainder of a 162-game season.
In other words, teams that struggle badly for the first two-thirds of the season generally continue to struggle.
The Exception That Proves the Rule
The image gives special attention to 2018.
Among all the seasons listed, the 2018 Mets had the strongest finish — and the only one of the nine where they played above. 500 ball, winning 33 games after Game 106. Yet even that remarkable turnaround only produced a final record of 77-85.
That detail may be the most important takeaway. A strong finish can improve the story of a season, but it does not necessarily erase the damage done by months of losing baseball.
The Boulder Analogy
Perhaps the most effective part of the graphic is the visual metaphor.
A Mets player is shown pushing a giant boulder labeled:
“18-20 games under .500 after 106 games”
The boulder sits on a steep hill leading toward a sign that says:
“.500 Out of Reach”
The symbolism is clear. Every win helps, but when a team falls 18 to 20 games below .500, the climb back to respectability becomes extraordinarily difficult.
The symbolism is clear. Every win helps, but when a team falls 18 to 20 games below .500, the road back to respectability is like climbing a steep peak with a 50-pound pack on your back.
Baseball’s long season creates the illusion that there’s always time to turn things around. In reality, a team that spends four months piling up losses eventually runs into a harsh truth: the deeper the hole, the more extraordinary the finish required simply to reach .500.
What History Tells Us
The dugout scene delivers the infographic’s central conclusion:
- No playoffs
- No winning seasons
- Mostly more losing
While fans naturally hope for a turnaround, the historical sample presented here suggests that expectations should remain realistic. Across decades of Mets history, teams with fewer than 45 wins through 106 games have never transformed those seasons into playoff runs or winning records.
Final Thoughts
The infographic is not really about one season. It is about the power of baseball history and the challenge of overcoming sustained underperformance.
Its message is blunt: by Game 106, teams usually are what their record says they are.
For Mets fans, that may not be the most encouraging lesson. But as the data shows, climbing out of a deep hole is far more difficult than simply playing better for a few weeks. Even a strong finish often leaves a team looking up at .500, realizing that the opportunity to save the season disappeared long before the final month arrived.
Leave a Reply