
Freddy Peralta had a 5.37 ERA with the Mets. Yet, FanGraphs projects him to pitch much better the rest of this season.
How can both be true?
According to FanGraphs’ 2026 rest-of-season projections for Peralta, he is expected to pitch considerably better over the remainder of the year than his ERA suggests.
For baseball fans unfamiliar with analytics, that raises an obvious question:
How can a computer model disagree with what the box score appears to be saying?
The answer provides a perfect introduction to FanGraphs, one of baseball’s more influential analytics websites, and the projection systems that teams, fantasy managers, and data-driven fans use to look beyond what has happened and estimate what comes next.
What Is FanGraphs?
At its core, FanGraphs is a baseball statistics and analysis website. Like many sports sites, it tracks traditional statistics such as wins, losses, batting averages, and ERAs.
What makes FanGraphs different is its focus on understanding player value and forecasting future performance. Along with historical statistics, FanGraphs provides advanced metrics, projections, leaderboards, and analysis designed to answer questions that traditional stat pages often cannot.
When most fans look at a player page, they are asking: What has this player done?
FanGraphs encourages a different question: What is this player likely to do next?
A Quick Guide to FanGraphs Projection Systems
One of the first things newcomers notice when they browse a player’s page on FanGraphs doesn’t offer just one projection. Instead, it displays several forecasting systems side by side. Think of them as different weather forecasts. Each uses a different approach, but all are trying to forecast what lies ahead.
ZiPS (Szymborski Projection System)
ZiPS, created by Dan Szymborski, looks at a player’s career history, age, and comparable players to estimate future performance. It is particularly well known for its long-term forecasts and organizational projections.
Steamer
Steamer is one of the most widely respected projection systems in baseball. It draws heavily from recent performance trends and skill indicators to forecast future results. Many analysts consider it one of the industry’s most reliable models.
ATC (Average Total Cost)
ATC takes a different approach. Rather than building forecasts independently, it combines projections from several systems and weights them based on historical accuracy. Think of it as the “wisdom of the crowd” strategy.
THE BAT
THE BAT incorporates a great deal of contextual information, including park effects and playing environments. It has become especially popular in fantasy baseball circles because of its detailed player forecasts.
OOPSY
The newest projection system on FanGraphs is OOPSY. According to FanGraphs, “OOPSY aims to summarize all of the information you see on a player page — a whole slew of component statistics from different years, leagues, levels, and teams, compiled at different ages — in an attempt to make it easier to evaluate players.” The article’s author, Jordan Rosenblum, refers to it as “your friendly neighborhood projection system.”
So Which One Should You Trust?
The good news is that you don’t have to choose.
Many analysts look at multiple projection systems simultaneously. When several models independently reach the same conclusion, confidence in the forecast tends to increase.
In Peralta’s case, the various projection systems generally agree on one important point:
His future performance is likely to be better than his current 5.37 ERA suggests.
What Makes FanGraphs Different?
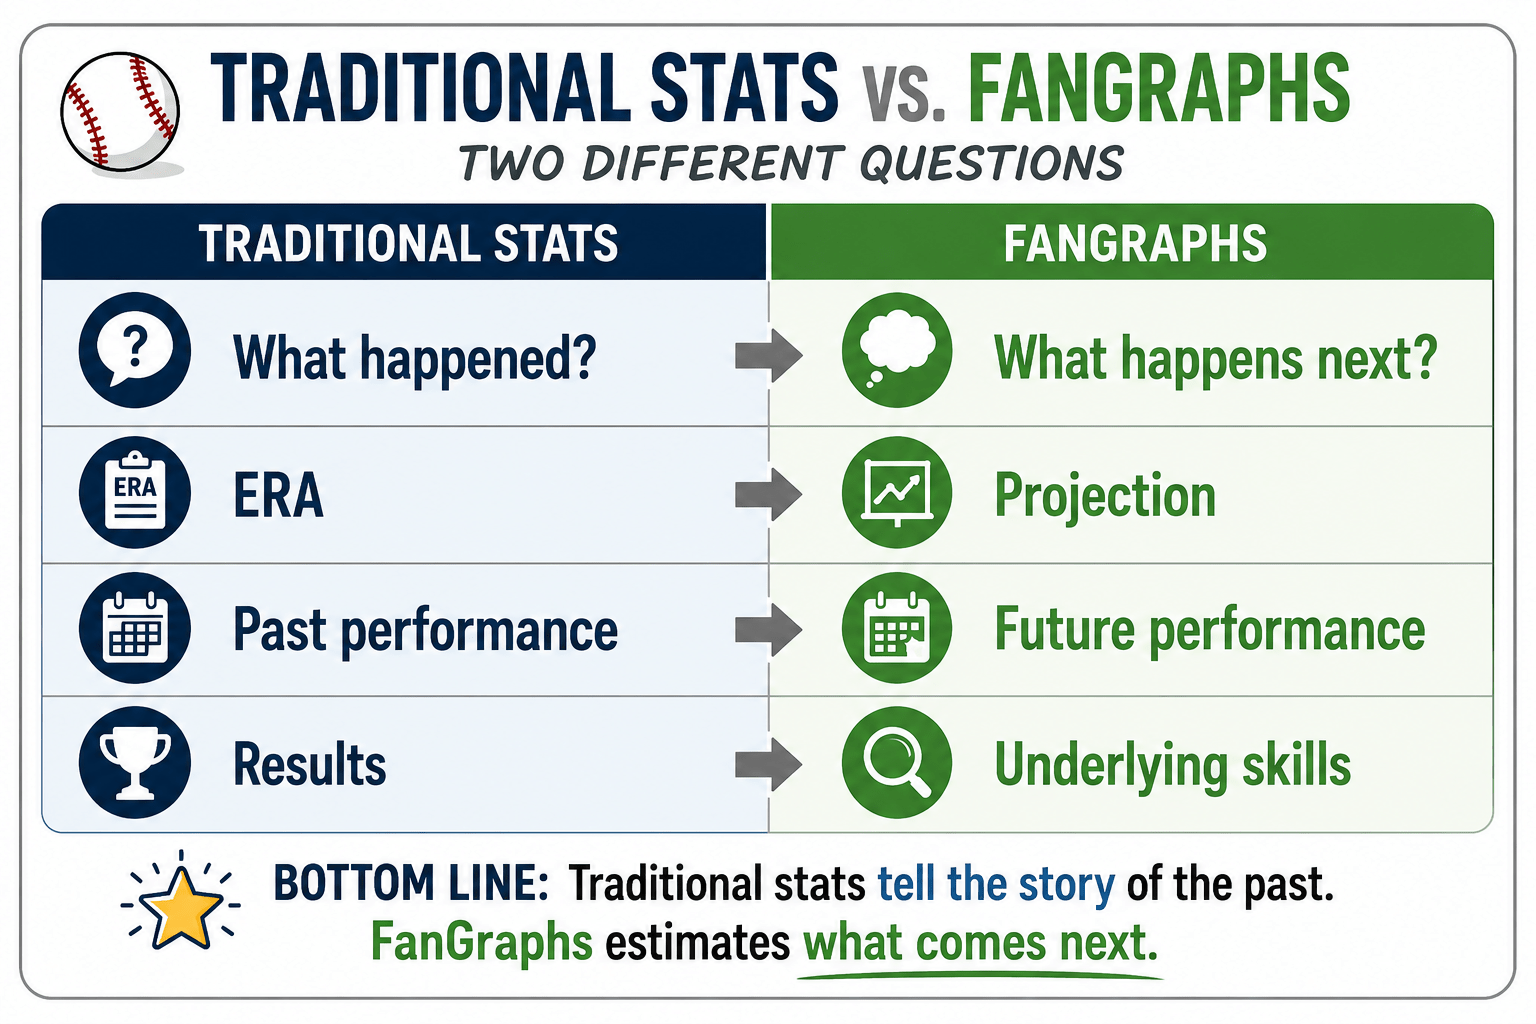
This is where FanGraphs separates itself from many traditional baseball sites. Most sites focus on what already happened. FanGraphs focuses on what is likely to happen next.
If a pitcher has a 5.37 ERA, a traditional stat page simply reports that number. FanGraphs digs deeper and asks whether that ERA accurately reflects the pitcher’s actual skill level.
To answer that question, FanGraphs relies heavily on statistics that tend to predict future performance better than traditional numbers.
For pitchers, those include:
- Strikeout rate
- Walk rate
- Home-run rate
- Pitching workload
- Batted-ball tendencies
- Historical performance trends
The reason is simple: some statistics are better at predicting the future than others.
Why don’t projection systems simply trust a player’s current ERA? The answer is one of the more important ideas in baseball analytics.
Understanding Regression to the Mean
A key idea behind most projection systems is something called regression to the mean.
Suppose a pitcher has spent several years performing like a 3.70 ERA pitcher. Then, over part of one season, that pitcher posts a 5.37 ERA. Projection systems generally do not assume the pitcher has suddenly become a 5.37 ERA pitcher.
Instead, they examine a wider body of evidence:
- Career history
- Age
- Strikeout rates
- Walk rates
- Home-run rates
- Recent trends
The goal is to estimate a player’s true talent level rather than react to a short stretch of results. That idea lies at the heart of why projections often differ from current statistics.
What Does FGDC Mean?
On Freddy Peralta’s FanGraphs page, the first projection row is labeled FGDC. It stands for FanGraphs Depth Charts, the site’s flagship projection system. It combines major projection systems such as ZiPS and Steamer with FanGraphs’ own playing-time estimates. FanGraphs uses these projections throughout the site for standings forecasts, playoff odds, and player outlooks.
The row also has the column “ROS,” which stands for Rest of Season. That means the numbers represent what FanGraphs expects Peralta to do from now until the end of the season.
Freddy Peralta’s Rest-of-Season Forecast
According to the FGDC projection on August 5, 2026, Peralta is expected to produce roughly these numbers:
- 3-3 record
- 9 starts
- 50 innings pitched
- 9.34 strikeouts per nine innings
- 3.46 walks per nine innings
- 1.24 home runs per nine innings
- 4.10 ERA
- 4.10 FIP
- 0.8 WAR
None of those numbers jump off the page as elite. But compared to his current performance, they tell an important story.
Why the Projection Is Encouraging
Peralta currently owns a 5.37 ERA. FanGraphs projects a 4.10 ERA the rest of the way. That difference tells us the model believes his future performance should be noticeably better than his season-to-date results.
The projection is essentially saying that while Peralta has struggled, his underlying skills remain stronger than the ERA alone suggests.
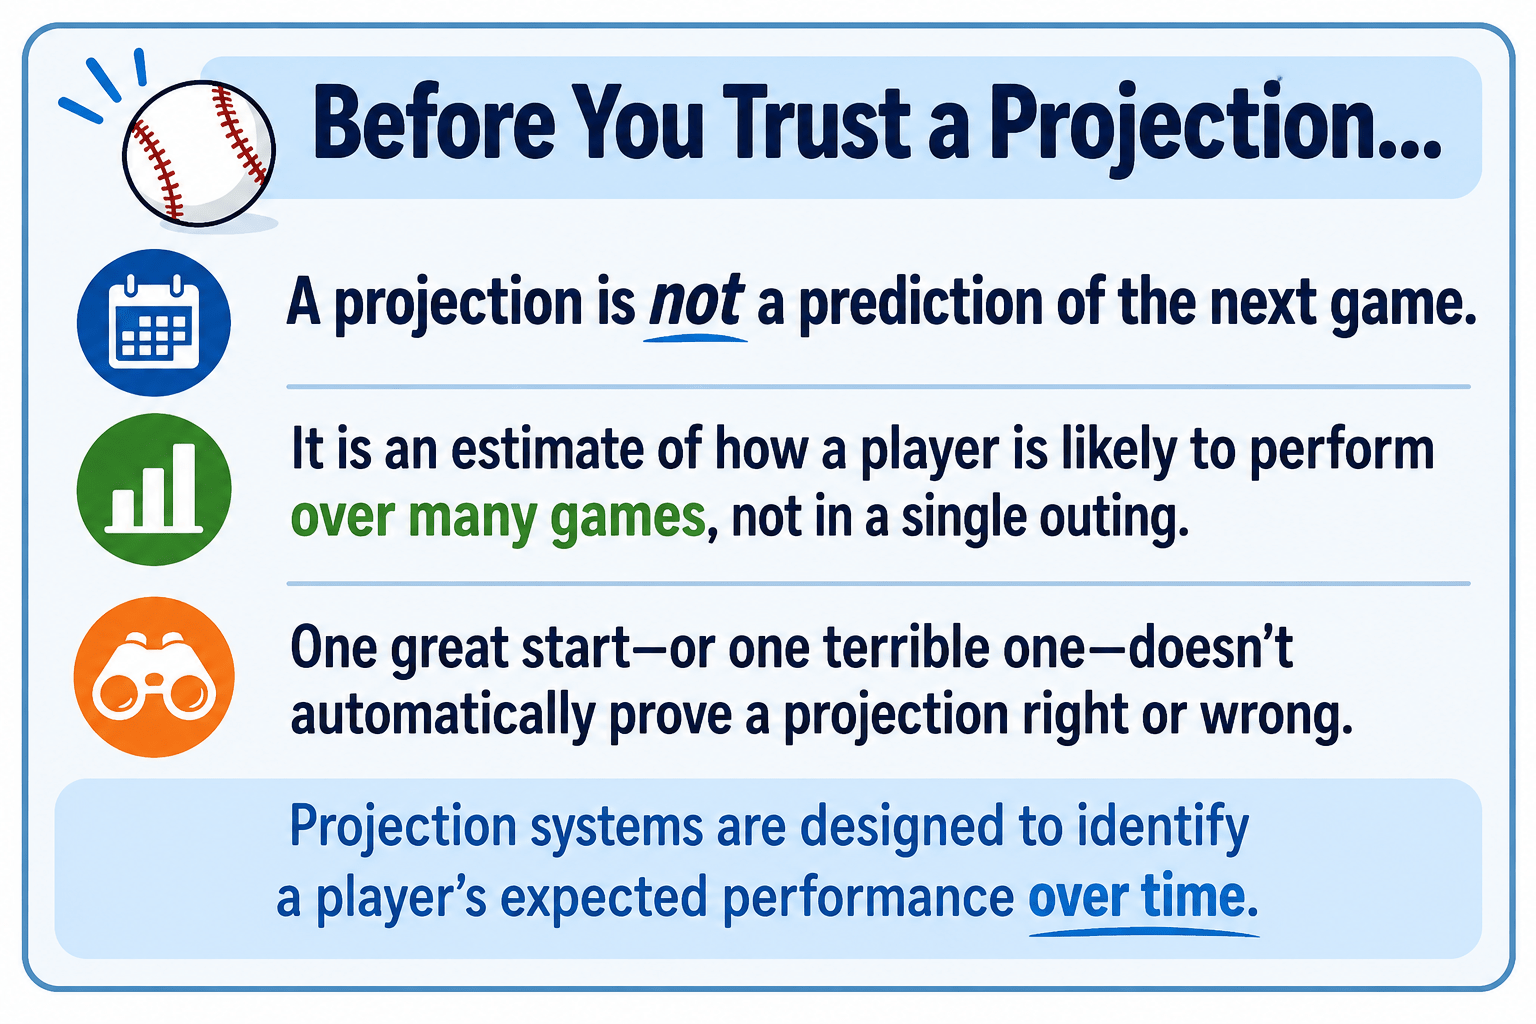
There is one important caveat, however. Projections are forecasts, not guarantees. In Peralta’s first start after being traded by the Mets, he allowed seven runs in 3.2 innings, a performance that looked much more like the pitcher reflected in his 5.37 ERA than the pitcher FanGraphs projected going forward. But a single start is exactly the kind of event projection systems are designed to look beyond.
FanGraphs’ models are not trying to predict what will happen in any one game. They are attempting to estimate a player’s average performance over dozens of innings and multiple starts. Just as a weather forecast can miss a thunderstorm on a particular afternoon while still being correct about the overall climate, a projection can survive one bad outing if the underlying estimate remains sound. In fact, one poor performance after a projection is published does not mean the projection was wrong.
The real test comes over time. If Peralta finishes the season pitching closer to a 4.10 ERA level than a 5.37 ERA level, the projection will have done its job. If he continues to struggle for the remainder of the season, the model may have overestimated his true talent level. That uncertainty is part of what makes baseball analytics fascinating.
Projections are not crystal balls. They are educated estimates built on historical data, underlying skills, and probabilities. Sometimes they look brilliant. Sometimes baseball surprises everyone.
The Strikeouts Still Matter
So why is FanGraphs more optimistic than Peralta’s ERA? One important reason is his ability to miss bats.
The projection forecasts a 9.34 K/9 rate, which remains comfortably above league average. (In the National League, it’s 8.39.) Even if he is no longer pitching like an ace, FanGraphs still views him as a pitcher capable of missing bats consistently.
Strikeouts are one of the most predictive pitching statistics available, which is why projection systems pay so much attention to them.
ERA and FIP Tell the Same Story
Another interesting detail is that Peralta’s projected ERA and projected FIP are both 4.10. FIP, or Fielding Independent Pitching, focuses largely on the outcomes pitchers control most directly: strikeouts, walks, and home runs. When ERA and FIP are the same, the projection is essentially saying that Peralta’s expected future results closely match his underlying skills. In other words, FanGraphs is not projecting unusually good luck or unusually bad luck to influence his performance going forward.
Not an Ace, but a Valuable Starter
The projection does not forecast a return to Cy Young contention. Instead, it paints the picture of a reliable mid-rotation starter.
A pitcher who throws roughly 50 innings with a 4.10 ERA, solid strikeout numbers, and 0.8 WAR over the final weeks of the season still provides meaningful value to a club.
Why Should Fans Care?
This is where analytics becomes useful.
Many fans see a 5.37 ERA and conclude that a pitcher is having a bad season. The statistics on FanGraphs support the idea that Peralta’s results so far have been disappointing. However, FanGraphs’ projection systems suggest his future performance may be better than those results indicate.
That distinction matters.
Front offices use projection models to evaluate trades and free agents. Fantasy managers use them to identify buy-low opportunities. Savvy fans use them to distinguish between genuine decline and temporary underperformance.
For Peralta, the takeaway is simple: Don’t evaluate him solely by his ERA. The projection suggests there is still a solid pitcher underneath those disappointing results.
When Should You Access FanGraphs?
For newcomers, here’s a simple rule:
Open FanGraphs when you want to understand where a player is headed, not just where a player has been.
Traditional stat sites are excellent for answering questions such as:
- What happened last night?
- How many home runs does this player have?
- What are his career numbers?
FanGraphs becomes useful when you’re asking:
- Is this slump real?
- Is this breakout sustainable?
- Should I expect improvement?
- Did my team make a smart trade?
- What does the rest of the season look like?
Using Peralta as an example, a traditional stat page says Freddy Peralta has a 5.37 ERA. FanGraphs asks: Does Freddy Peralta still pitch like a good major league starter? Those are very different questions.
FanGraphs vs. Baseball Savant
As fans become more comfortable with analytics, another site often enters the conversation: Baseball Savant.
The easiest way to understand the difference is this:
- FanGraphs is the forecast.
- Baseball Savant is the evidence.
FanGraphs uses models to estimate future performance. Baseball Savant provides detailed Statcast information such as pitch velocity, spin rate, exit velocity, launch angle, and pitch movement.
A FanGraphs user might ask: Will Peralta improve?
A Baseball Savant user might ask: Has his fastball velocity changed? Is his slider still getting swings and misses?
The two sites complement each other beautifully. FanGraphs tells you what may happen. Baseball Savant helps explain why.
The Bottom Line
For new fans, FanGraphs can seem intimidating at first glance. But its purpose is surprisingly straightforward. The site is trying to estimate future performance, not merely document past results.
Freddy Peralta’s page illustrates that idea perfectly. His 5.37 ERA tells one story. FanGraphs’ projections tell another. The models see a pitcher who can still miss bats, contribute meaningful innings, and provide value despite a disappointing stat line.
Understanding why those two stories differ is the first step toward understanding modern baseball analytics.
This is ultimately why baseball fans use FanGraphs. It’s not because they want more numbers. It’s because they want better answers.
Leave a Reply