
What Baseball Savant Reveals
How does a pitcher lose the effectiveness of every pitch in his arsenal while barely losing any velocity?
That’s the mystery surrounding Freddy Peralta’s disappointing 2026 season.
His ERA climbed. His strikeout rate fell. He no longer resembled the pitcher who finished among the National League’s best starters in 2025.
For many fans, the explanation seems simple: Peralta wasn’t as good.
But baseball has become increasingly sophisticated in how it evaluates pitchers. Traditional statistics tell us what happened. Modern tracking data often helps explain why it happened.
When you compare Peralta’s Baseball Savant pages from 2025 and 2026, a much more nuanced story emerges. Rather than showing a pitcher who suddenly lost his talent, the data suggest that something changed in the way his pitches “performed.” The challenge is figuring out what.
Baseball Savant Is Baseball’s Advanced Report Card
If you’ve never visited Baseball Savant, don’t let all the colorful graphics intimidate you. Think of it as baseball’s advanced report card.
Instead of focusing only on ERA, wins, or strikeouts, Savant measures the quality of a pitcher’s pitches and compares those results with every other pitcher in Major League Baseball. Most categories are shown as percentile rankings.
- A pitcher in the 90th percentile performed better than 90% of major league pitchers in that category.
- A pitcher in the 50th percentile is league average.
- A pitcher in the 10th percentile performed better than only 10% of major league pitchers.
The farther the bar extends to the right, the better.
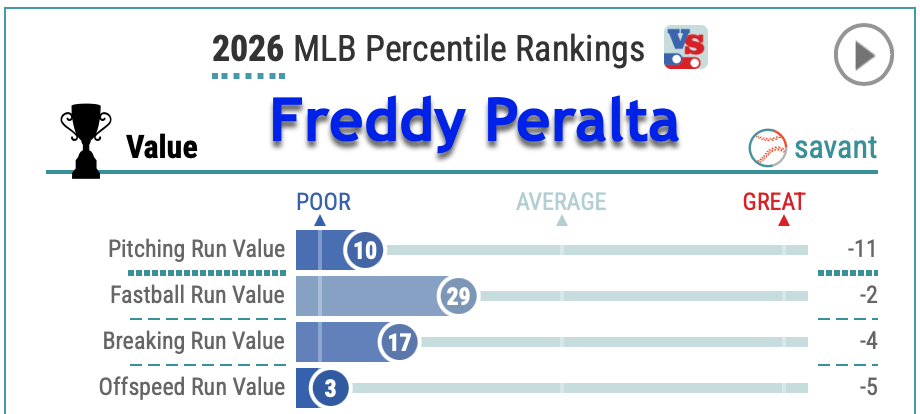
If you’d like to explore Peralta’s complete Statcast profile, including pitch movement, release point, and expected statistics, visit his Baseball Savant page after reading this article.
Run Value: One Statistic Worth Knowing
The first statistic to understand is Run Value.
Think of Run Value as answering one simple question:
How much did this pitch help prevent runs compared with the average major league pitch?
Every fastball, slider, and changeup is evaluated throughout the season. For a pitcher, a fastball that produces a strikeout or weak popup adds value. A fastball that is driven into the gap for a double loses value.
Over hundreds of pitches, those results accumulate into a season-long measure of how effective each pitch really was.
Notice what Run Value does not measure.
It isn’t measuring velocity. It’s measuring effectiveness.
Two pitchers can both throw 94 mph fastballs. One consistently misses bats while the other gives up line drives. Their velocities are identical, but their Fastball Run Values can be dramatically different.
That distinction turns out to be critical in understanding Peralta’s season.
Every Pitch Declined
The biggest surprise isn’t that Peralta struggled. It’s that every part of his repertoire became less effective.
| Pitch | 2025 | 2026 |
| Overall Pitching Run Value | 97th percentile | 10th percentile |
| Fastball Run Value | 84th | 29th |
| Breaking Ball Run Value | 88th | 17th |
| Offspeed Run Value | 96th | 3rd |
If only his fastball had declined, perhaps hitters adjusted to that pitch.
If only his slider had become less effective, perhaps its movement had changed.
Instead, every type of pitch deteriorated at the same time.
That suggests the problem wasn’t isolated to one pitch. It points toward something common to all of them.
Velocity Wasn’t the Culprit
Whenever a successful pitcher struggles, the first question fans ask is whether he lost velocity.
Peralta didn’t.
His average four-seam fastball declined from 94.8 mph in 2025 to 94.2 mph in 2026. A drop of six-tenths of a mile per hour is noticeable, but it’s rarely enough to transform an elite pitcher into an ordinary one.
If velocity wasn’t responsible, what was?
That question becomes even more interesting when we examine two other statistics.
Hitters Stopped Swinging Through His Pitches
Peralta’s strikeout rate dropped from the 84th percentile to the 44th percentile, while his whiff rate declined from the 83rd percentile to the 61st percentile.
Those numbers tell us hitters were making contact much more often.
For a pitcher like Peralta, that’s significant.
He has never relied solely on overpowering velocity. His success has been built on deception—making different pitches look alike long enough to keep hitters from recognizing what’s coming.
When hitters begin identifying pitches earlier, they don’t have to chase as many bad pitches or swing underneath as many fastballs.
They simply make more contact.
The Clues Point Toward Mechanics
This is where the investigation becomes interesting.
Every pitch in a pitcher’s arsenal begins with the same delivery. If that delivery changes, every pitch can change with it.
During the season, reports pointed to adjustments in Peralta’s arm slot, release point, torso rotation, and pitch movement. His extension—the distance toward home plate where he released the baseball—also declined from the 81st percentile to the 54th percentile.
None of those changes, by themselves, proves why Peralta struggled.
Taken together, however, they are consistent with the idea that subtle mechanical changes affected his entire repertoire.
That would also explain why every Run Value category declined at the same time.
What About Pitch Tunneling?
Those mechanical changes may also have affected one of baseball’s least understood concepts: pitch tunneling.
Pitch tunneling refers to making different pitches look identical for as long as possible after they leave the pitcher’s hand. A fastball and slider should follow nearly the same path before separating late. The longer they stay together, the less time hitters have to recognize which pitch is coming.
If Peralta’s release point or arm slot changed, that deception may have been reduced.
The pitches themselves may not have lost much velocity. Instead, hitters may simply have recognized them earlier.
That possibility fits the statistical evidence, although it does not prove that pitch tunneling was the primary cause of his decline.
One Statistic Doesn’t Fit the Theory
Good investigations also examine evidence that complicates the story. One statistic actually improved. Peralta’s Barrel Rate jumped from the 34th percentile to the 86th percentile. For pitchers, that’s a positive development because it means hitters produced fewer perfectly struck baseballs.
At first glance, that seems inconsistent with the rest of the data. How can a pitcher allow fewer barrels yet have a much worse season?
The answer is that no single statistic explains everything. Peralta may have allowed fewer ideal swings while simultaneously giving hitters more opportunities to put the ball in play because they weren’t missing nearly as many pitches. Other factors, including sequencing, defense, and simple baseball luck, may also have contributed.
That’s why it’s important to look at the entire collection of evidence rather than relying on one number.
Why the Rays May See Opportunity
This is one reason Tampa Bay may have viewed Peralta differently than many fans did. Pitchers who lose velocity often have limited options for regaining it. Pitchers whose mechanics drift are a different story.
The Rays have built a reputation for helping pitchers refine deliveries, improve pitch shapes, and restore effectiveness. If they believe Peralta’s decline stemmed primarily from mechanical changes rather than deteriorating ability, they may see a rebound candidate instead of a pitcher in permanent decline.
What Next?
The Rays clearly believe Freddy Peralta can be more than the pitcher who struggled in 2026. The question is whether they can identify—and correct—the underlying cause of his decline.
If the problem was simply lost velocity, there may be little anyone can do. Pitchers rarely regain the fastball they once had.
But Peralta’s Baseball Savant profile tells a different story. His velocity declined only slightly. Instead, the effectiveness of his fastball, breaking ball, and offspeed pitches all fell sharply at the same time. Reports during the season also pointed to changes in his arm slot, release point, and overall mechanics.
Those clues suggest the issue may have been how he delivered the baseball rather than how hard he threw it.
If Tampa Bay’s coaches can restore the mechanics that made Peralta the pitcher he has been for most of his career, they may also restore the deception, pitch tunneling, and swing-and-miss ability that fueled his success.
Whether that happens remains one of the more intriguing pitching stories to watch in 2027.
If Peralta returns to form with the Rays, the lesson won’t simply be about one pitcher. It will remind us that beneath every disappointing ERA lies another question worth asking:
What really changed?
Related
Run Value: A Better Way to Understand Baseball Statistics
Leave a Reply